Cumulative Home Run Frequency and the Recent Home Run Explosion
This article was written by Gabriel Costa - Mike Huber - John Saccoman
This article was published in 2005 Baseball Research Journal
British Prime Minister Benjamin Disraeli once remarked that there are three kinds of falsehoods: lies, damned lies, and statistics. While this may be debated on political and philosophical levels, there are circumstances where statistics (and graphs and charts) can shed some truth and light. Perhaps this is one of those times.
In this paper we define a measure which we call the cumulative hame run ratio (CHR). We consider every player in history who has slugged 500 home runs, and compute their year-to-year total of home runs (HR) divided by their at-bats (AB). After which, we compare this accumulated HR/AB ratio to the slugger’s corresponding age.
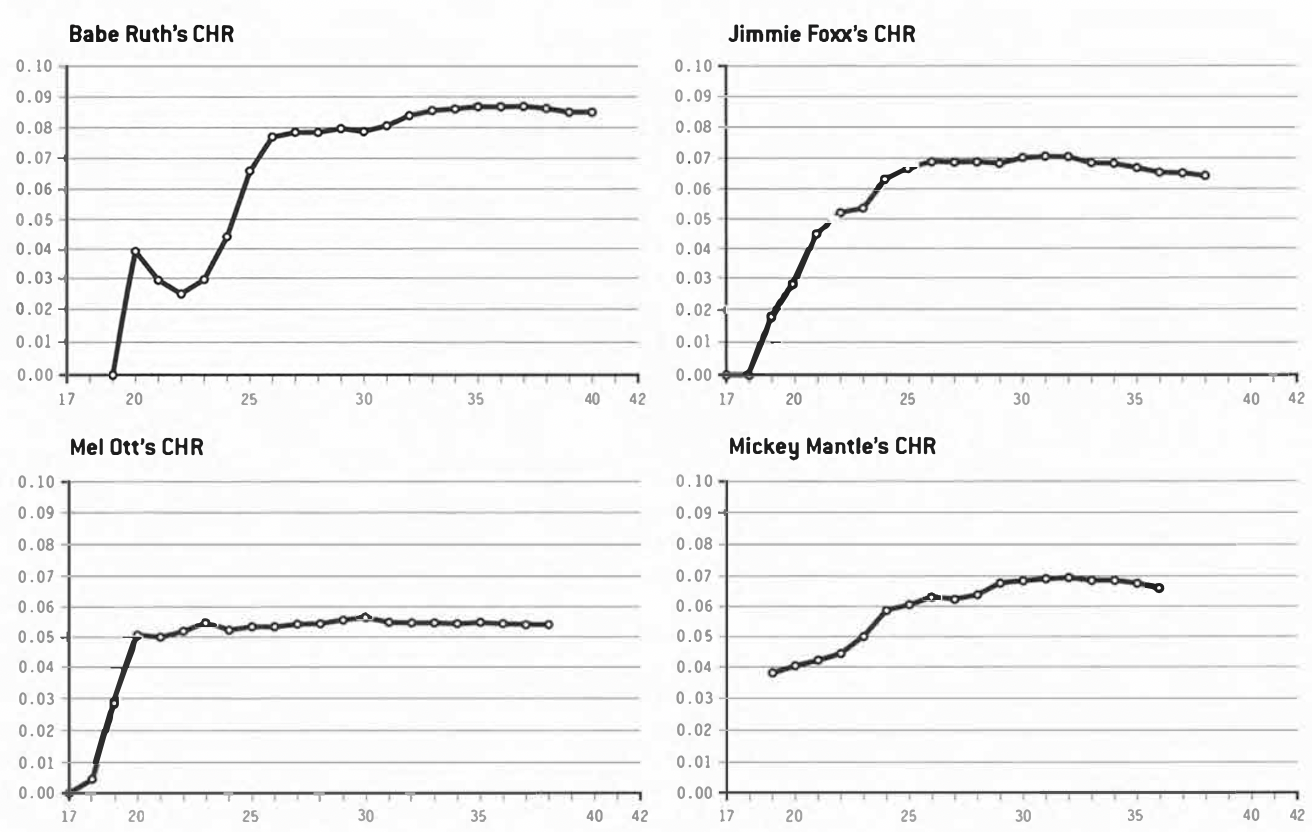
For example, from Table 1 below, in 1914 Babe Ruth hit 0 HR in 10 AB. This gives the 19-year-old Ruth a proportion of HR to AB equal to 0.000000. The next year (1915), Ruth hit 4 HR in 92 AB; Ruth’s cumulative home run ratio over his two years as a pro becomes 0.039216 (4 HR in 102 AB) at age 20. Since he hit 3 HR in 136 AB in 1916, his CHR at the age of 21 is computed to be 0.029412 (7 HR in 238 AB). The data in Table 1 continues Ruth’s major league career and provides his CHR for each season.
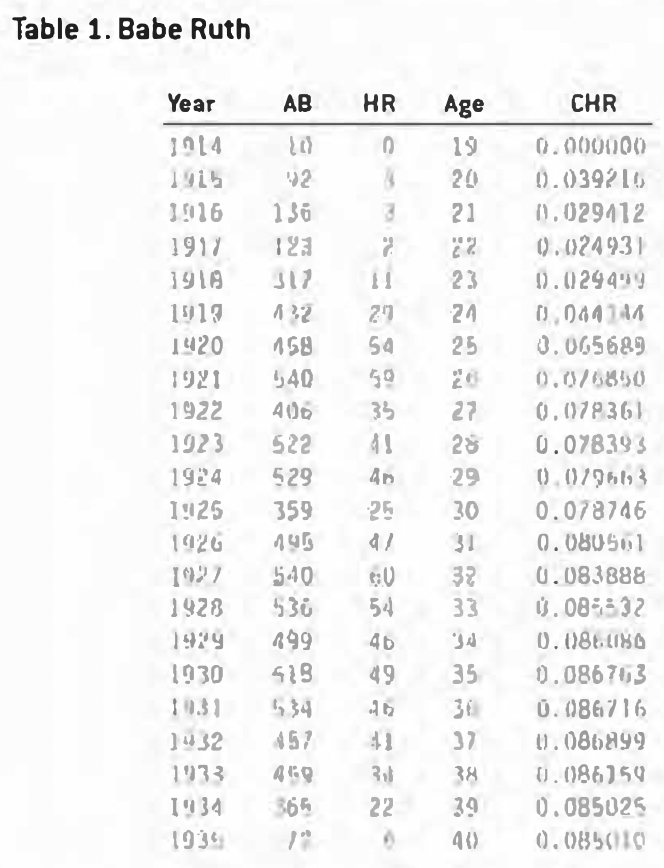
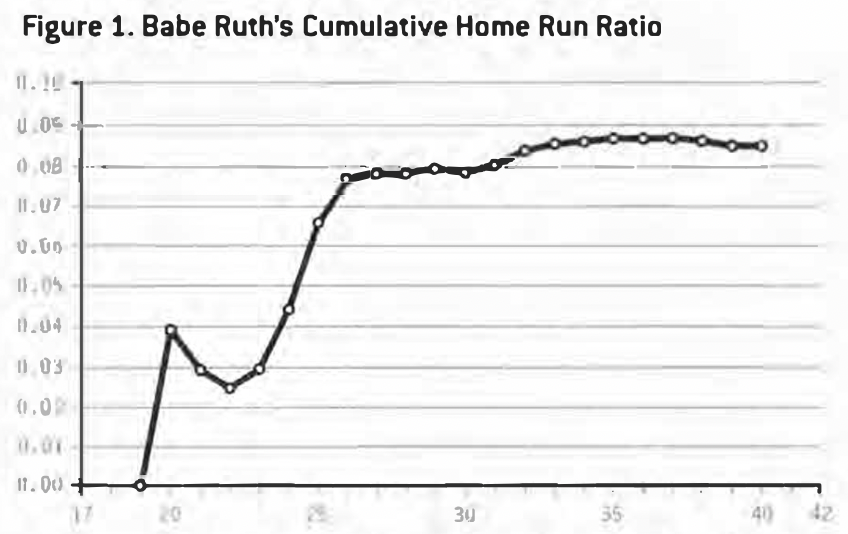
Figure 1 shows the plot of Ruth’s age (horizontal axis) versus his CHR (vertical axis) over his career. Ruth’s CHR seems to level off in his mid-to-late 20s, and remains fairly constant for the next 10 years or so. Graphically, we can see that Ruth’s CHR levels off toward a limiting value of roughly .085 or 8.5 HR per 100 AB for his career. In fact, this limiting value seems to “converge” to a ”natural” or a “predictable” number, since from 1928 through the end of his career in 1935, his CHR hovered near this value.
One particular question which arises is the following: “Did most, if not all, 500+ home run hitters level off with respect to CHR around the same age as Ruth?”
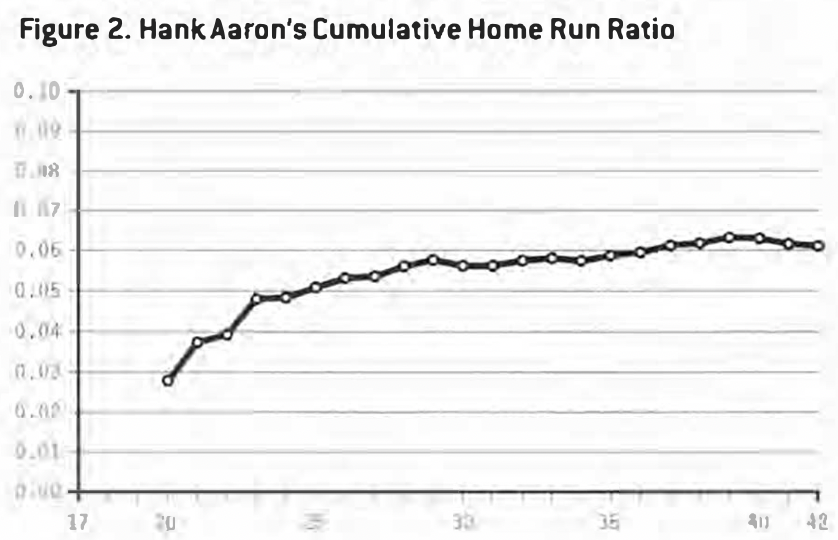
In Figure 2, we present the CHR for Hank Aaron, the all-time home run leader. We see here that Aaron’s CHR, like that of Babe Ruth’s, has relatively little variation from his mid-20’s onward. We note that his final CHR value converges nicely to approximately .061, very near his CHR from the age of 28 onward.
Some interesting observations about CHR can be made:
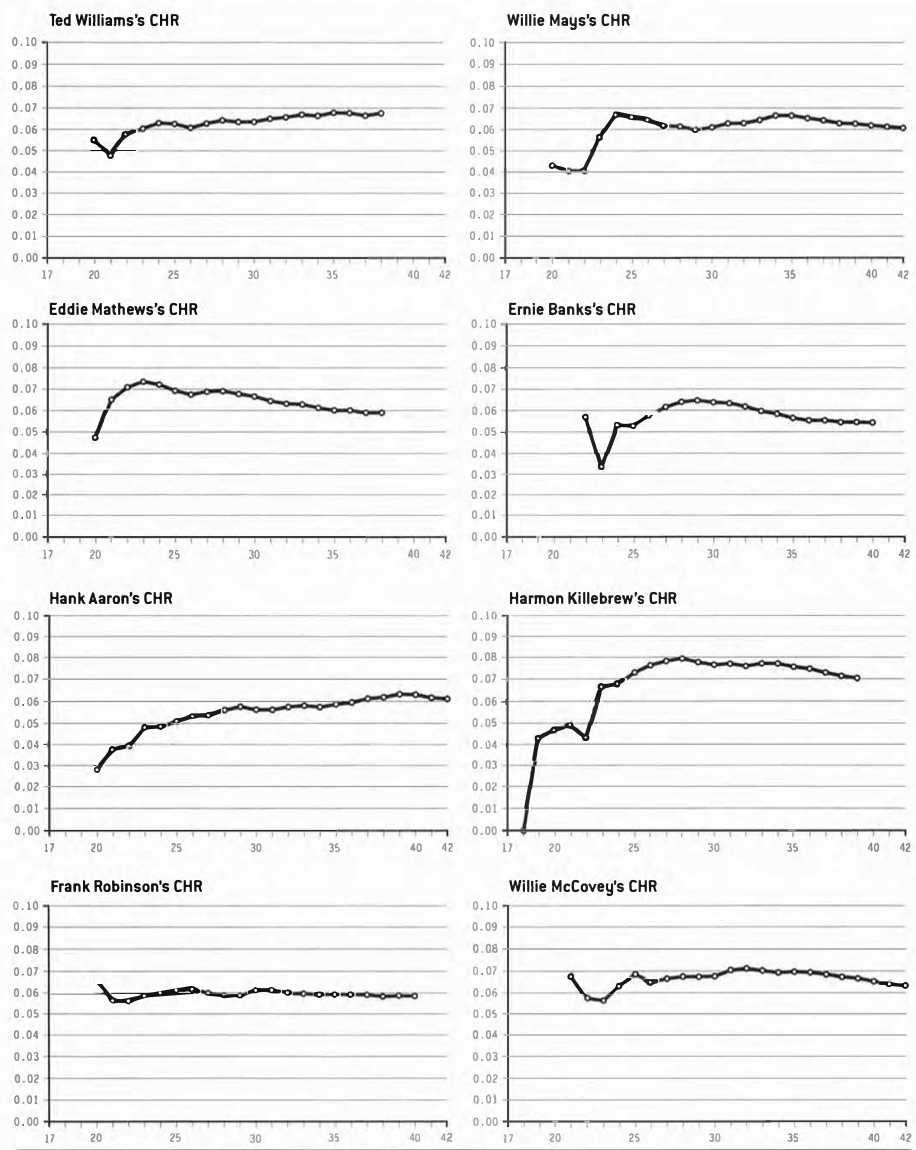
- Sluggers like Mel Ott and Frank Robinson have CHRs which are nearly constant, as reflected in their charts by virtually flat lines.
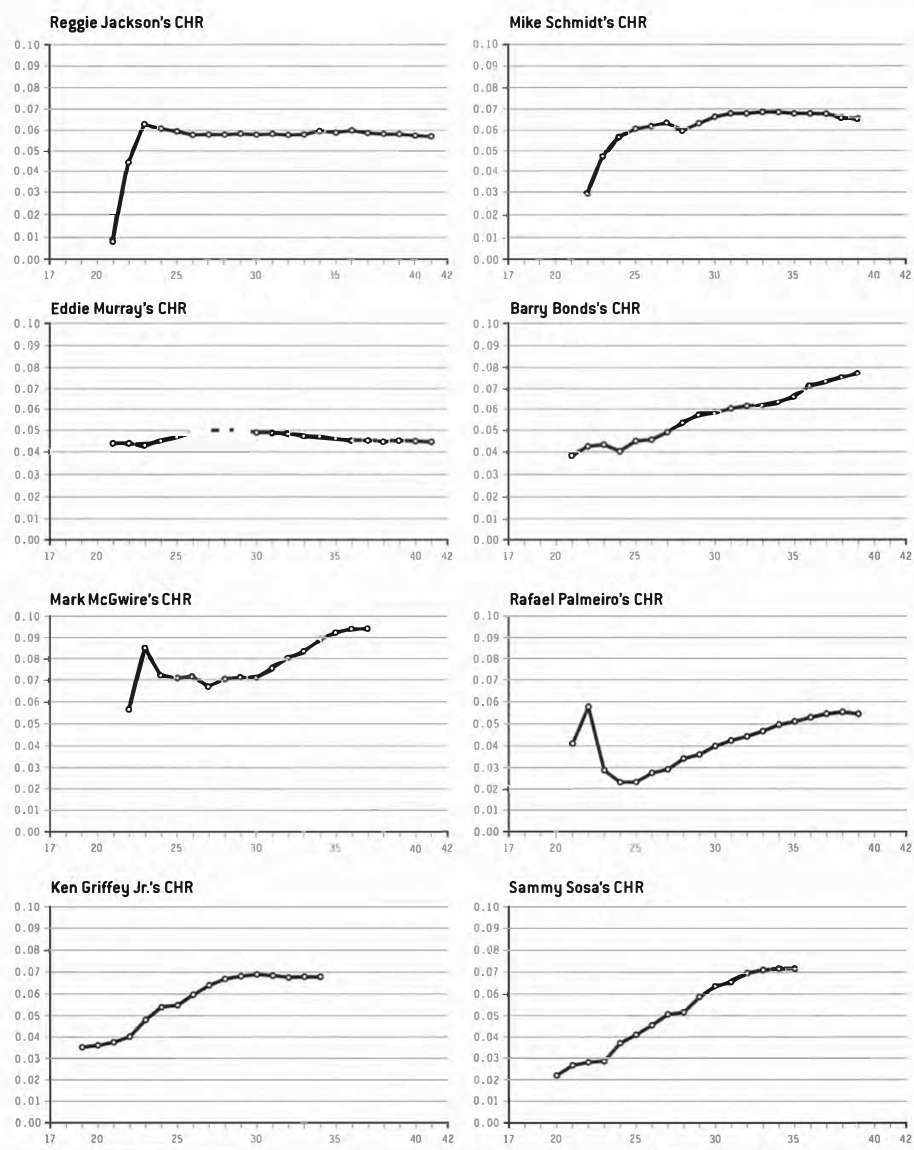
- Most 500+ home run hitters attain a final CHR which could have been accurately estimated by the time they reached their mid-to-late 20s.
- Multi-seasonal 50+ home run hitters like Ruth, Foxx, Mantle, and Mays all level off by their mid-20s.
- Third baseman Eddie Mathews is the only member of the 500 Home Run Club to have peaked in his early 20s and then have his CHR actually decline over his career.
- For the most part, consistency in CHR is independent of lifetime batting average: Ted Williams at .344, Mel Ott at .304, or Reggie Jackson at .262.
- For the most part, consistency in CHR is independent of players with frequent injuries (e.g., Mickey Mantle), interrupted careers (e.g., Ted Williams and Willie Mays), or longevity of careers (e.g., Willie McCovey).
We have seen that as the sluggers’ careers progressed, their CHR reached a particular value and remained there. This was true of Aaron, who had a slight increase in CHR in his early 30’s, but very little “variability” thereafter; it was true of Willie Mays; ditto for Mike Schmidt. In fact, the CHR for Hall of Famers such as Jimmie Foxx, Mel Ott, Frank Robinson, and Reggie Jackson have virtually the same graphical trends as the sluggers who played before them. The bottom line appears to be that the great sluggers have CHRs which level off (or reach a limit) as they enter their late 20’s.
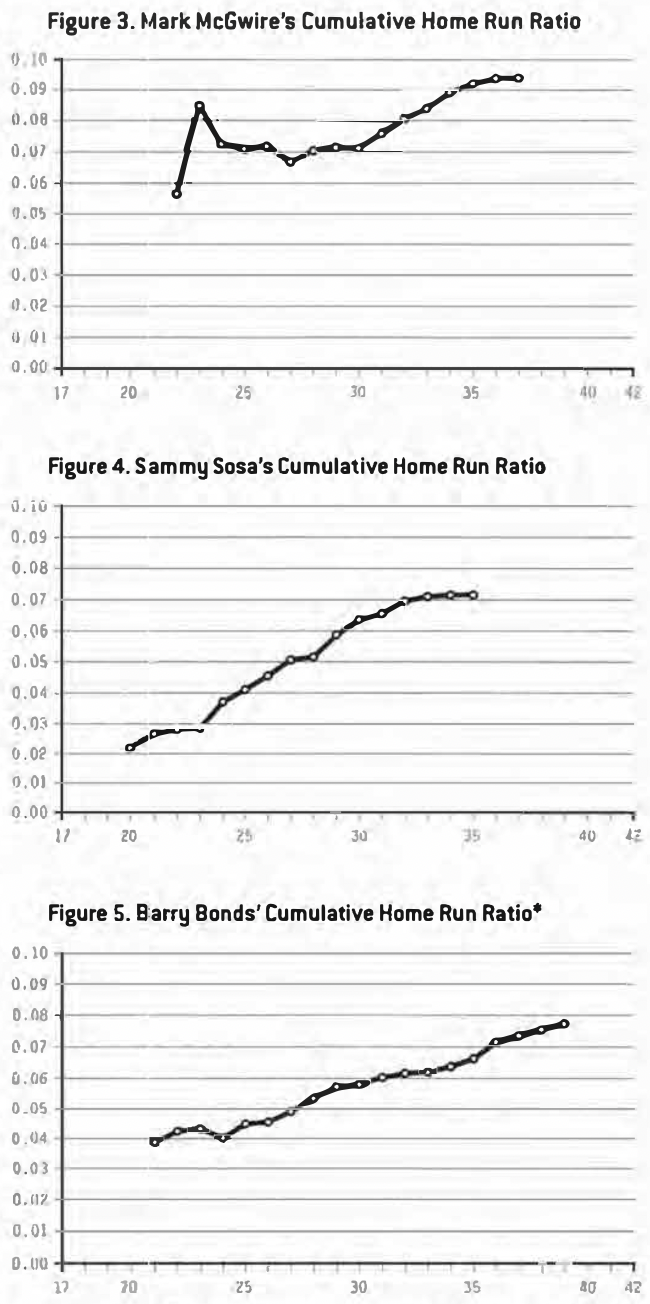
While the observations above are generally true, we find exceptions, particularly with players who starred over the past decade or so. The home run explosion over the past 10 years has generated many questions spanning quite a few areas. For many, the names of Mark McGwire, Sammy Sosa, and Barry Bonds bring these questions and a host of emotions to the foreground. How can such players hit home runs with an increasing frequency so relatively late in their careers? Is the pitching that much worse? Are other factors involved?
Figures 3, 4, and 5 represent the CHRs of the aforementioned McGwire, Sosa, and Bonds. The trends of these graphs appear to be significantly different than the CHRs of the others. In fact, the following three graphs reflect unparalleled performances, because of the increasing – rather than the leveling-off – CHRs.
Appendix