

In Search of Clutch Hitting
This article was written by Tom Ruane
This article was published in 2005 Baseball Research Journal
Clutch hitting is back in fashion in the baseball research community. For years many of us looked in vain for the existence of some persistent clutch-hitting ability and, failing to find it, came to the conclusion that such an ability must not exist.
The pioneer of this approach was Dick Cramer, who wrote an article on this subject in the 1977 Baseball Research Journal, but many of us have done similar studies. First, you determine who performs better than normally one year in “clutch situations” (and the definitions of these situations change from study to study) and then you see if these players have a tendency to repeat their performance the next season. They don’t, which has led a generation of baseball researchers to roll their eyes whenever announcers start rhapsodizing about Joe Blow’s ability to come through when it counts.
In “Underestimating the Fog,” an article in the 2004 Baseball Research Journal, Bill James argues that we were wrong to think that such an approach “proved” anything. There is so much random noise inherent in this method, so much “fog,” that we shouldn’t expect to see anything when looking for clutch ability in this manner. I might get around to testing this hypothesis at some point, but for now I thought I’d take a different tack.
I thought it might be interesting to compare a player’s ability in both clutch and non-clutch situations over the course of his career. I’m not really looking for persistence in results from one year to the next, but rather I’ll be looking for results that are not what we’d expect to see if there were only random forces at work. Hopefully, dealing with much larger groups of at-bats will help to thin out the fog somewhat.
Identifying “Clutch”
The first problem facing anyone undertaking a study like this is that we don’t really know what “clutch” means. Or rather, it seems to mean something different whenever it’s used, depending upon the point we are trying to make. Ted Williams was once accused of not being a clutch player based upon his performance in a handful of games, selected both because they had a significant impact on his team’s chances to win a world championship and because he performed relatively poorly in them. Games in the middle of a tight pennant race weren’t clutch, only a couple at the very end of a few seasons. Others have defined terms like “Late Inning Pressure Situations” to identify players who perform well or poorly in a handful of at-bats near the end of close games.
One lazy way out of this problem (hint: it’s the one I’ll be taking) is to define a clutch situation as an at-bat with runners in scoring position. In a sense, this is nonsense: a leadoff hitter in the late innings of a tie game is usually a much more clutch situation than a batter at the plate with a runner on second and a 15-2 lead. Still, it’s often what we mean by “clutch.” I don’t know about you, but when someone talks about how well this or that player has hit in the clutch, I usually test the statement by checking to see how the man has hit with men in scoring position. These at-bats may not all be the most pressure-packed of the season, but they probably come close enough for our purposes.
Situational Biases
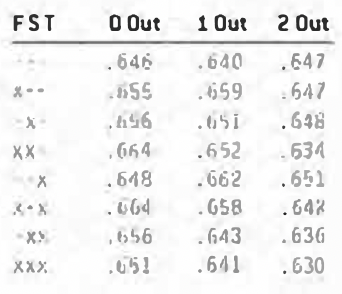
There is a problem with taking this approach, however: batters do not hit equally well in all situations. Table 1a contains a breakdown of banner stats for each of the 24 game situations from 1960 to 2004. Note: this data is not complete for these years, and for the purposes of this article we will be ignoring any games for which we are missing play-by-play information.
I thought it might be easier to see some trends if I compressed the data in a few ways. Aggregate performance by outs is listed in Table 1b, aggregate performance with men on base is in Table 1c. and with runners in and out of scoring position in Table 1d.
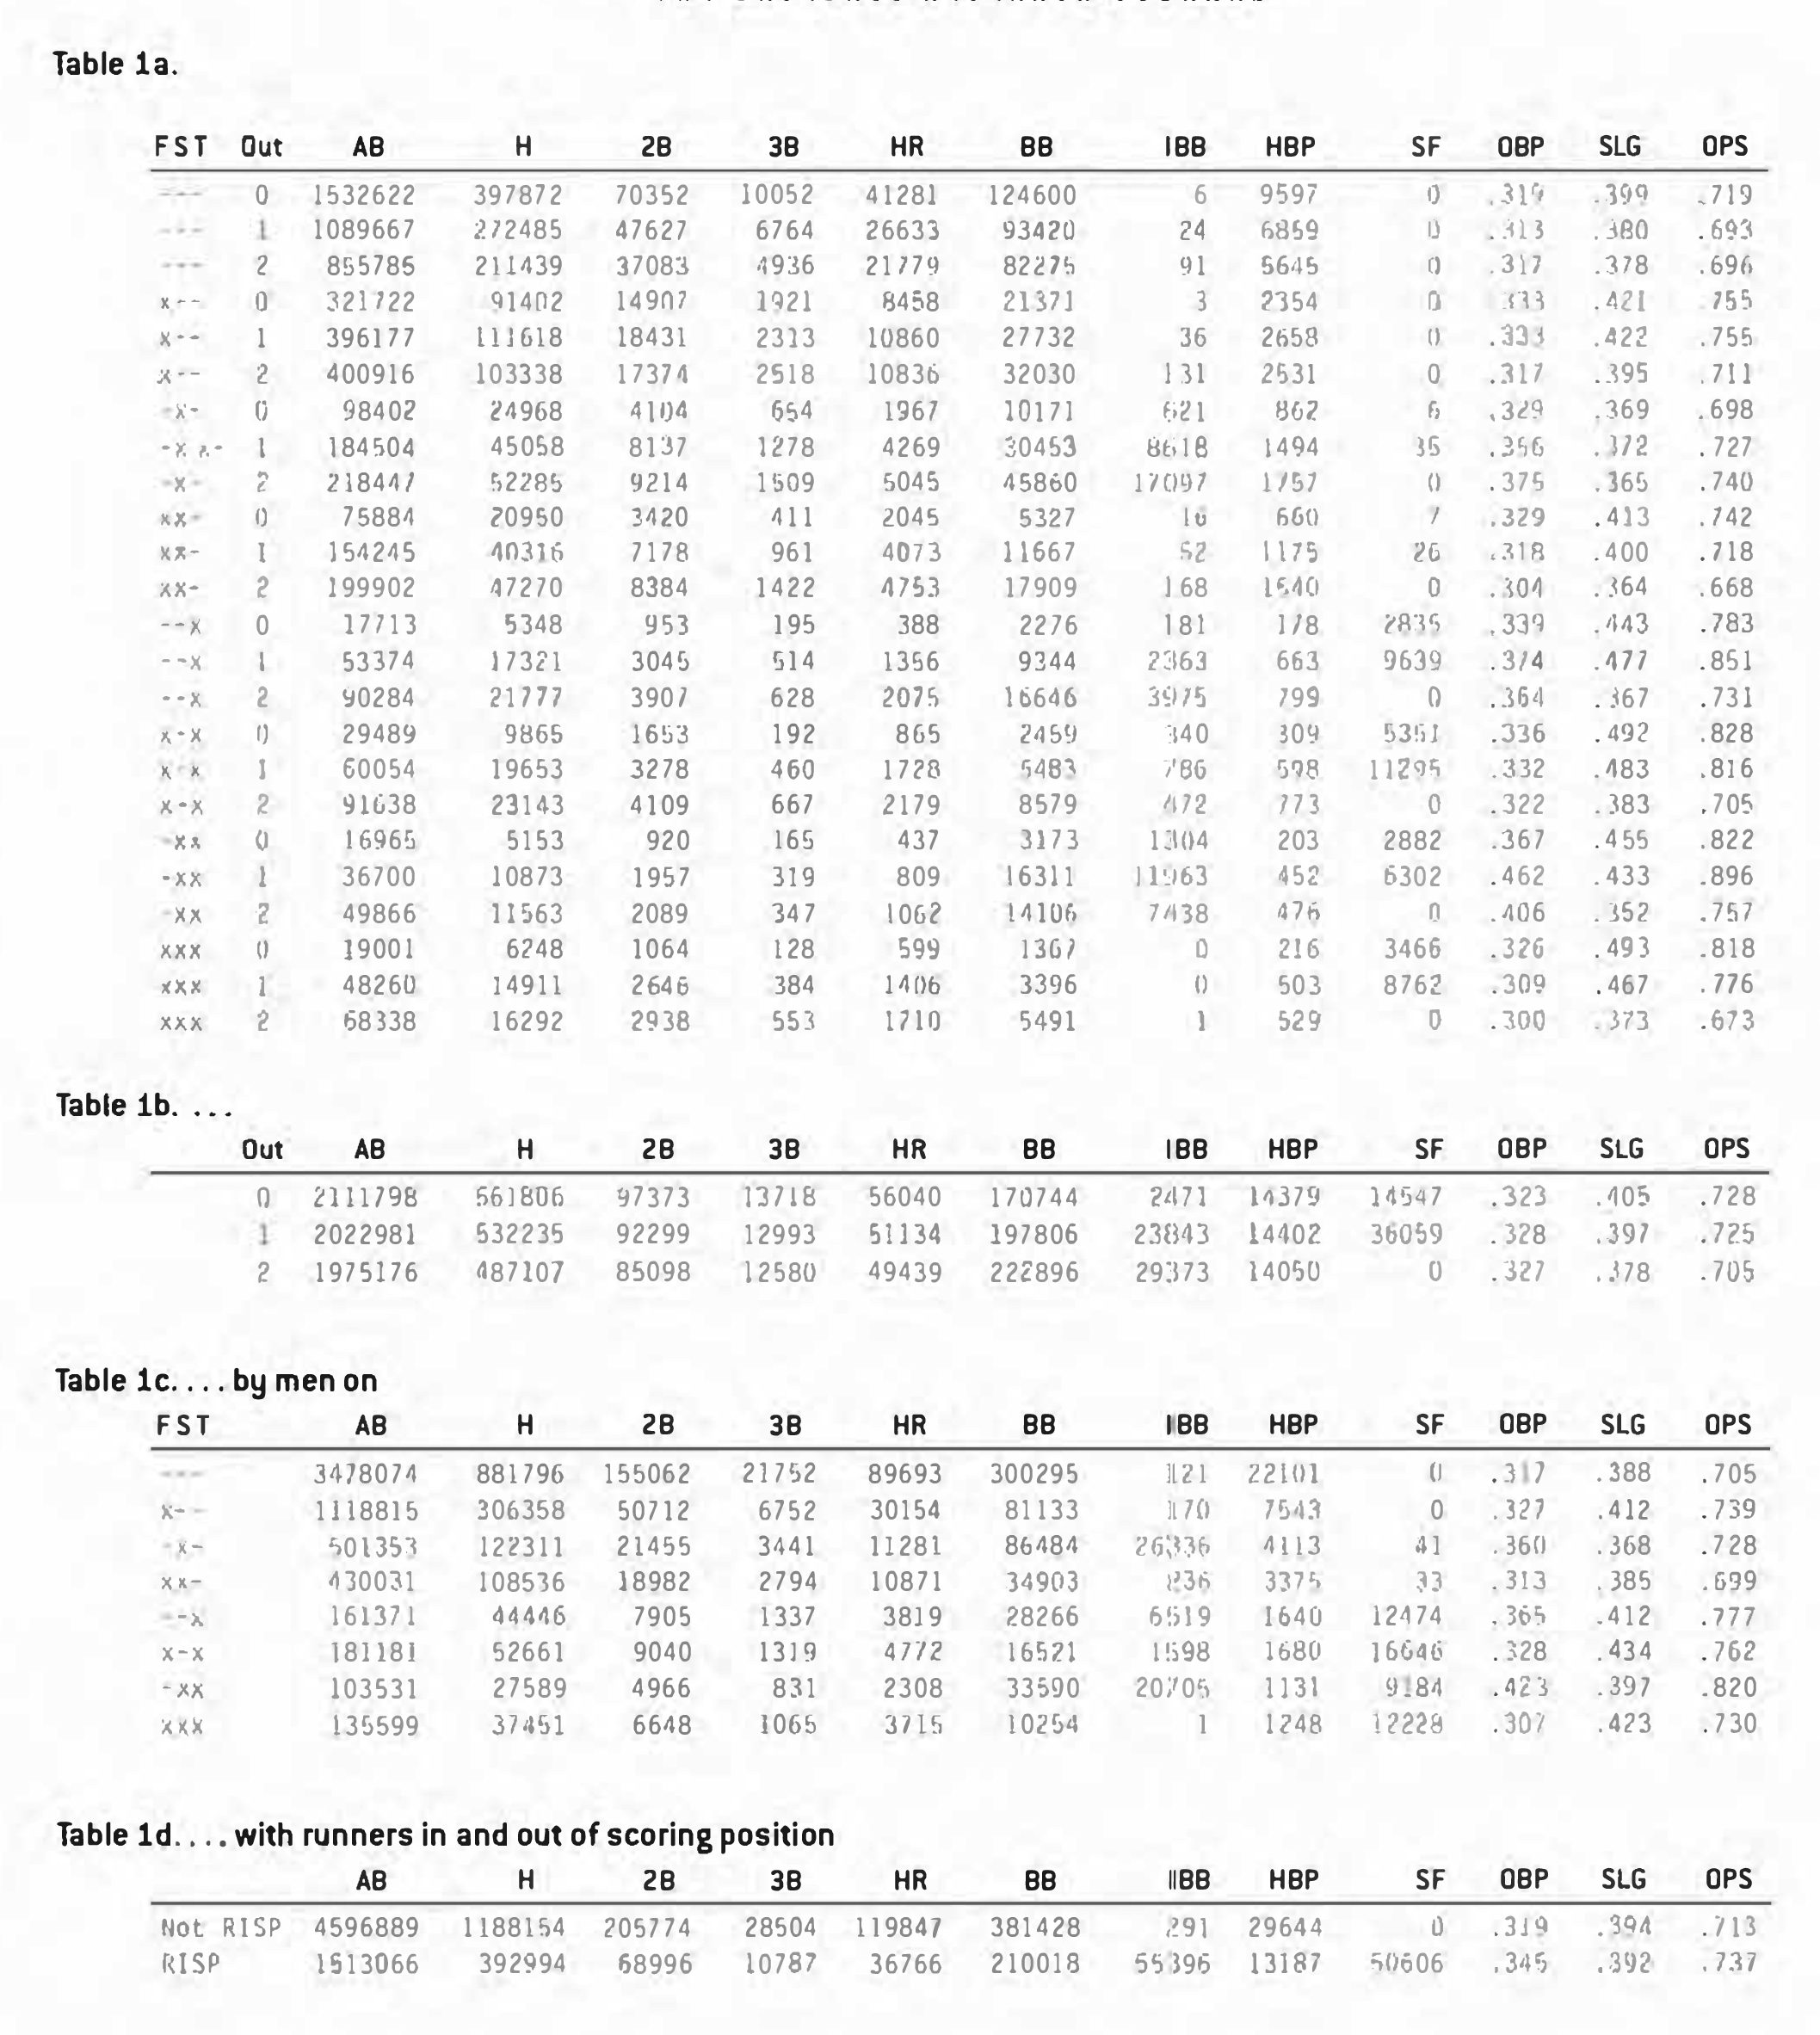
With men in scoring position, batters have just about the same slugging percentage and a higher on-base percentage than they do in their other at-bats. So they hit somewhat better in these situations. Except, of course, that they don’t.
There are two deceptive things about comparing situational statistics in this manner. First of all, sacrifice flies occur only with a lead runner on third or (very rarely) on second. These are about the same as run-scoring groundouts, and the decision not to count these as at-bats is a mistake first adopted in 1889 (when, who knows, perhaps it made sense), a mistake which has gone in and out of fashion over the years. I’m not sure how many of the sacrifice flies hit from 1960 to 2004 were actually struck with a sacrificial intent, but I’d be surprised if all but a handful of these were merely failed attempts at getting a hit. So the first thing we’re going to do in our study is to treat sacrifice flies as at-bats.
The second thing that’s misleading is walks. Walk rates vary quite a bit from situation to situation. With men on second and third and one out, a batter is nearly five times more likely to get a walk than he is with the bases loaded and one out. Most of this difference is due to intentional walks, which are easy to remove (and we will), but large differences in walk rates still remain even without them. Not only are these differences significant, but they vary quite a bit from batter to batter. The reason for this, of course, is that in some situations (most frequently with first base open) some batters are “pitched around” and sent to first via a non-intentional intentional walk. The decision to pitch to a batter in this manner is largely made based upon his reputation, the relative handedness of the pitcher and batter, and often simply because of a manager’s hunch.
As a result, in addition to treating sacrifice flies as outs in this study, l’nn also going to ignore walks. This is not to say that walks aren’t important, or are not in many instances the outcome of “clutch” at-bats, only that it is difficult to level the playing field with respect to walks and I don’t want a batter’s reputation inflating (or deflating) his apparent performance in clutch situations.
Finally, I’m also going to remove hit by pitches. Not that it can’t be clutch (and painful) to take one for the team, but I’d like to concentrate on the hitting aspect of batting rather than getting hit. With these changes made, here are the new situational breakdowns (see Tables 2a through 2d).
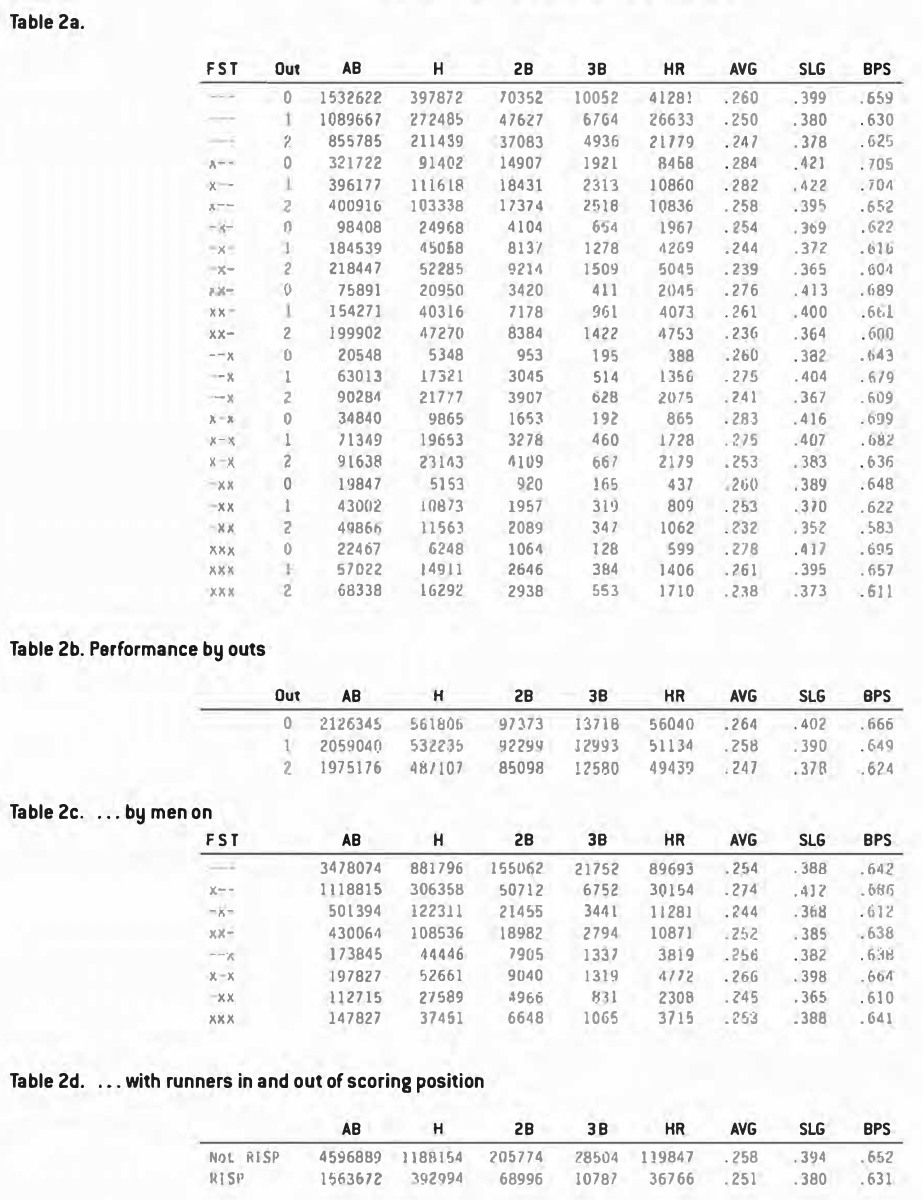
So with these adjustments, it’s clear that batters actually hit worse with runners in scoring position than they do otherwise.
Since batters hit best with a man on first, I thought it might be interesting to see how right-handed and left-handed hitters do in these situations [See Table 3a and Table 3b)
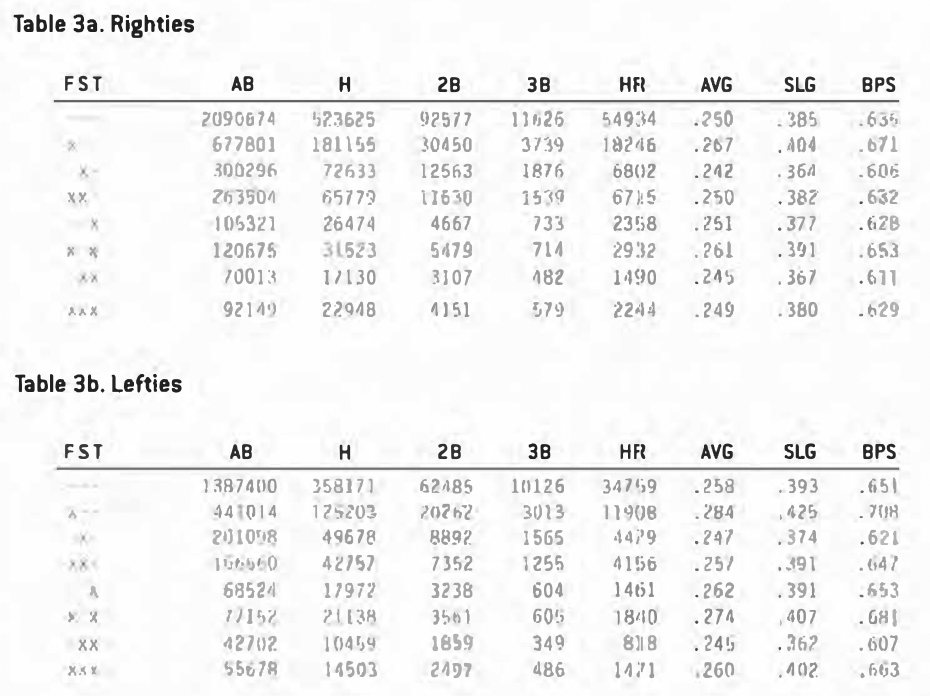
As expected, left-handed hitters are able to take more advantage of the man on first situation, since holding the runner on opens up a hole on the right side.
Since I want to do away with as much of the fog as possible in this study, I’m going to consider only those players with at least 3,000 at-bats (including sacrifice flies). This group of players should be significantly better hitters than the ones with less than 3,000 at-bats for two reasons. First of all, requiring a significant number of at-bats will eliminate all pitchers from the mix. And second, I’m assuming that batters with longer careers are better than those with shorter careers.
Before going much further, then, I wanted to see if my target group showed a similar decline with runners in scoring position. Table 4 displays the statistics for the two groups of batters.
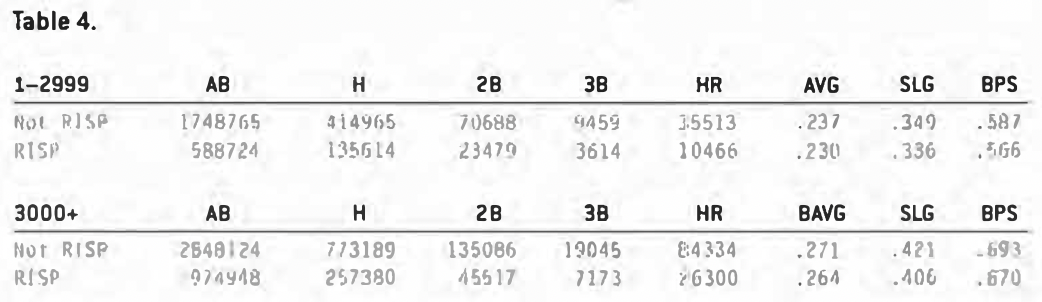
The percentage declines were about the same for the two groups. This isn’t what I would have expected if clutch hitting is a talent that some players have and others don’t. I would have assumed that the more talented group of hitters would have done better. Of course, there’s no reason why talent and clutch ability have to go hand in hand.
Still, I was surprised that batters, both good and bad, hit worse with men in scoring position. Much of this is due to the big spike in performance that occurs when there’s a man on first. Another reason is the presence of force-outs and fielder choices that aren’t available with no one on.
Still, the single worst hitting situation is second and third with two outs. One reason for this could be a selection bias: good hitters are often walked in these situations. As a result, the quality of hitters batting at these times is lower than at others. I thought this might be something we could look at. Here are the average BPSs of the hitters up in each of the 24 game situations:
Later on, we will explore some other possible explanations for the drop-off in performance with runners in scoring position.
The Players
Enough talk. So who were the greatest clutch hitters from 1960 to 2004, the players who were able to raise the level of their game when it mattered most (or at least when runners were on second or third)? Here they are:
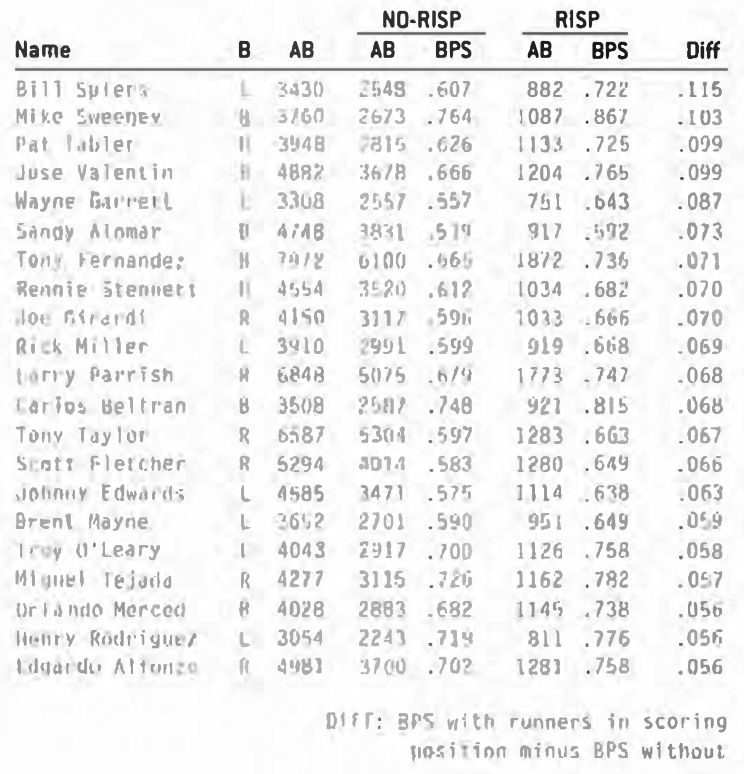
Just who I expected to see: Bill Spiers, Wayne Garrett, Rennie Stennett, Rick Miller … and the other side of the coin:
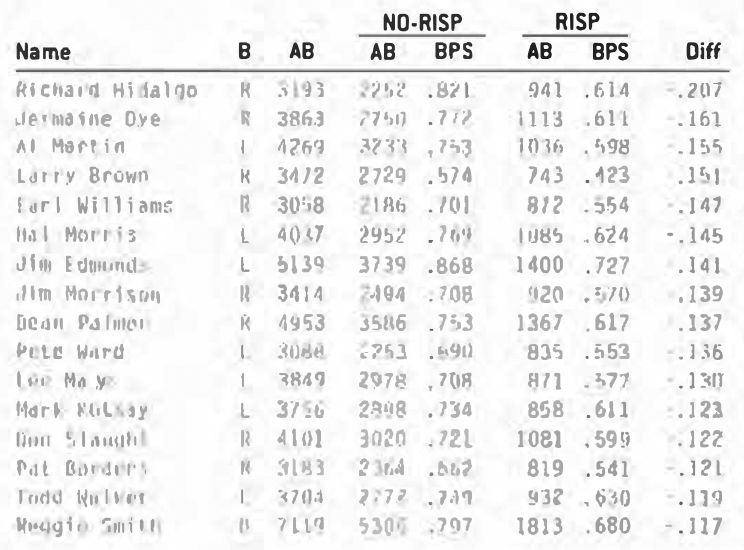
For lack of a better term (and so I don’t have to keep writing “the difference between a batter’s BPS with and without runners in scoring position”), I’m going to call this difference (“DIFF” in the charts above) Clutch Percentage. I know it’s not really “Clutch” and not really a “Percentage,” but it’s the best I could come up with.
The poor Clutch Percentages are more extreme than the positive ones, partly because the median of the group is not zero but rather -.027.
I’m not sure what I expected to see here. I doubt that if I had presented these two lists of players to you and told you that one was a list of the best clutch hitters and the other the worst, you could have figured out which was which.
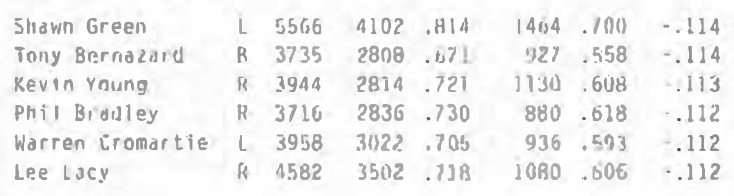
One of the things that bothers me about the last list is that 12 of the 20 players on it have less than 1,000 at-bats with runners in scoring position. Of the 727 players in the study, only a little more than 30% (222) fell into that category. If the differences we’re looking at were caused more by chance than talent, you’d expect to see players with small sample sizes at the two extremes.
Is the Data Random?
Could these results have been random? The way I usually approach this kind of question is with brute force. Rather than attempting to finesse the issue with mathematics, I run over it with simulation. My approach this time is perhaps best shown by example.
In the games we have, Vada Pinson had a runner on second or third in 2,114 of his 8,954 at-bats, or 23.6096%. So to simulate his random career, I generated 8,954 random numbers (one for each at-bat) between 0 and 1. If the number was less than .236096, I counted it as an at-bat with runners in scoring position. When I was done, I had randomly selected around 2,114 at-bats that I’m considering to be clutch. Using these two pools of at-bats (the ones selected by this process and the ones not selected), I computed his simulated Clutch Percentage.
One problem with this approach is that we already know that the data is not random. Players on average hit worse (in terms of BPS, 27 points worse) with men in scoring position. Our random tests will not reflect this. Since we’re doing these simulations to see how much random variation there will be in the data, this problem might not be fatal, but it does complicate things. For example, we will want to compare the amount of spread in both the real and simulated data. This spread will be centered around -.027 in the real run and .000 in the simulated runs.
I did 1,000 of these simulations. What did I find out? Well, there was nothing terribly unusual in the spread of the real data. In the random run the average distance from each player’s Clutch Percentage and the expected value varied from a low of .2872 to a high of .3512. The actual values differed by .3314, which was a little high but nothing out of the ordinary (117th place out of 1,001). In addition to looking at the spread, I also broke the range of values into 20 groups (each .015 wide except for the first and last) and saw if the distribution of the players were similar in both the real and the simulated worlds. Note that the midpoint in the two worlds is different, since the expected Clutch Percentage is -.027 for the actual values and .000 for the simulated ones. In Table 5, as a result, group A contains the count of players from .000 to .015 over the expected value, B contains the count of players from .015 to .030, and so on. Not too surprisingly, -A contains the count of players from .000 to .015 below the expected value, -B contains the count of players from .015 to .030 below, and so on (see Table 5).
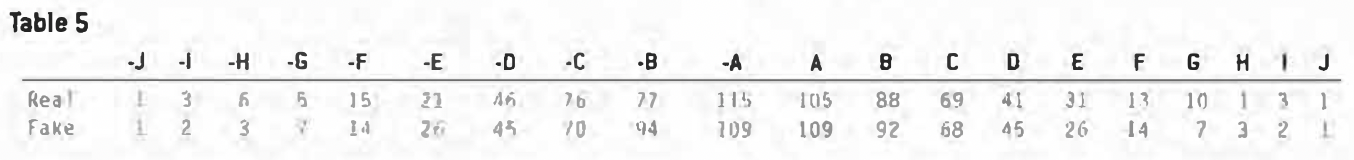
Our real distribution is very similar to the average of the fake ones. But it is important to note that this doesn’t prove anything. While a very different spread and distribution could be used to demonstrate that Clutch Percentage is not random, the fact that these results are similar is not evidence that only random forces are at work here.
Potential Problems
This section explores factors that may complicate things, causing batters to hit worse (or better) with runners in scoring position.
The first thing that occurred to me is that batters might be facing a platoon disadvantage more often with runners in scoring position than they might otherwise. To test this, I looked at batters who hit right, left, and from both sides of the plate, and determined how well they did against right and left pitchers. I next computed what types of pitchers they faced both with and without runners in scoring position and used that information to generate an expected BPS (batting average plus slugging percentage) given the mix of pitchers they saw in both situations. Here’s the data:
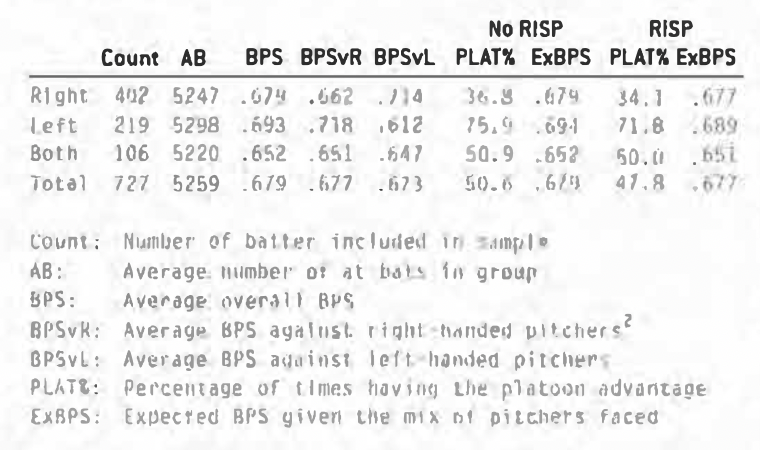
This table presents a lot of unfamiliar information, so it might be a good idea to go over a sample line. There are 402 right-handed hitters in our study. The average righty in the study had 5,247 at-bats and an overall BPS of .679. As expected, he hit lefties better than the righties (.714 to .662), but had a platoon advantage only 36.8% of the time with no runners in scoring position. Now, I didn’t assume that all right-handed hitters had a platoon advantage against left-handed pitchers. Instead, I determined which type of pitcher each batter performed better against over the course of his career. Most of the time, hitters did better against pitchers who threw from the other side, but not always. Given the percentage of pitchers of each type our hitters faced with no one in scoring position, and how they hit against these pitchers, righty hitters had an expected BPS of .679 in these situations. When runners were on second or third, the platoon advantage and BPS drop slightly to 34.1% and .677 respectively.
You should not assume from the chart above that switch-hitters had no platoon advantage or disadvantage. The reason why they hit almost the same against both righties (.651) and lefties (.647) is that the platoon differentials of switch-hitters tended to cancel each other out. To illustrate this, here are the players with 3,000 or more at-bats with the greatest platoon differentials:
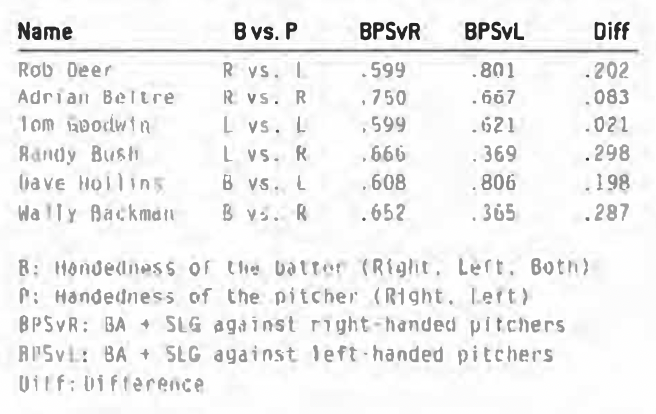
The average platoon differential is greatest for the lefties in our study (.107), and just about the same for right-handed hitters (.058) and switch-hitters (.057). People often assume that just because a batter hits from both sides of the plate that he hits equally well from each side. This is not the case, although it isn’t always obvious which side is their weakest (unless it’s someone like Wally Backman).
Platoon advantages by themselves are not sufficient to explain the fact that hitters tend to perform worse with runners in scoring position. The average dropoff is about 23 points of BPS (.693 to .670), and the expected dropoff due to platoon disadvantages is only two points for right-handed hitters, five points for lefties, and one point for switch-hitters. Of course, this effect is different for each player. Frank Howard, for example, punished lefties so much that he seldom faced them with men in scoring position, causing him to have a platoon disadvantage of 17 points. Tony Batista, on the other hand, is a right-handed hitter who has hit righties better than lefties over the course of his career. As a result, he has a platoon advantage of three points with runners in scoring position.
Another factor we might want to take into account is that the quality of pitchers is often worse in these situations. This makes sense. After all, when you’re up with men in scoring position, you are usually facing the pitcher who permitted those runners to reach base, something that happens a lot more frequently with a Jaime Navarro on the mound than a Roger Clemens. To determine how much worse they are, for each at-bat by one of the batters in our study, I calculated the pitcher’s opponents’ BPS, taking into account the handedness of the batter. I found that the average pitcher when runners are in scoring position is about three to four points worse (in BPS) than those on the mound when there aren’t. Not a big deal and a result that seems to balance out the platoon disadvantage, except, as with the platoon disadvantage, there are differences from player to player. The most extreme cases among the players in our study are Hal Morris, who has faced pitchers 17 points worse with runners in scoring position, and Larry Walker, who has faced pitchers 11 points better. All in all, I think it’s a good thing to check before anointing someone either a great or a poor clutch hitter.
The last thing we want to look at is any possible park effects. After all, there are more runners in scoring position in good-hitting parks. So I calculated the average park factor for the two situations and, to make a long story even longer, here’s what I found:
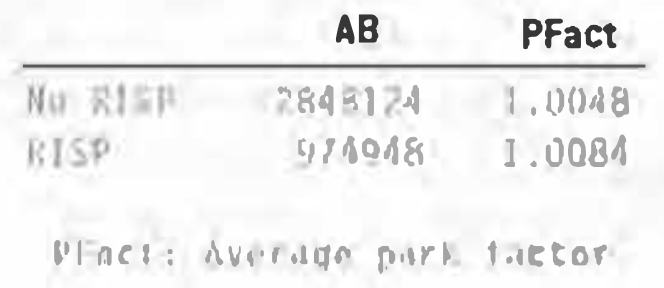
Since there are more at-bats in a typical game in a hitter’s park than there are in a pitcher’s park, it’s not too surprising that the average park factor in both groups would be greater than one. Note that the advantage with runners in scoring position is slight. Still, this is not insignificant for all players. The two extremes:
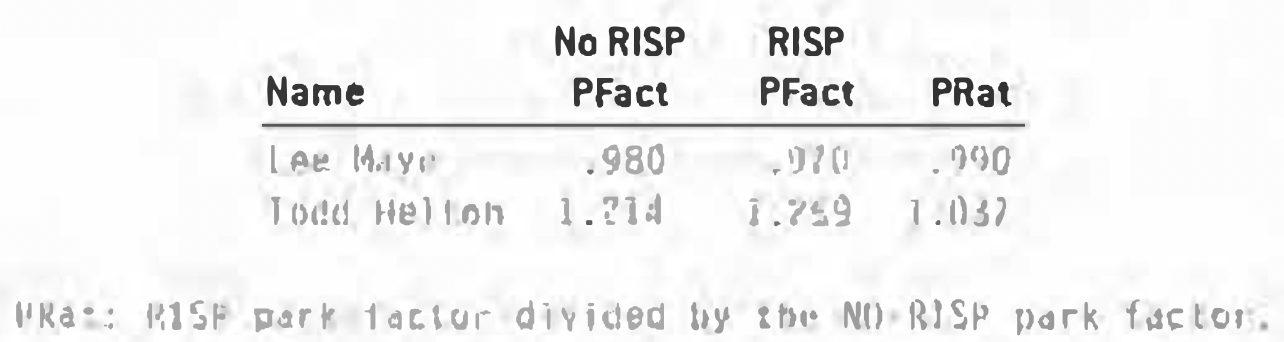
It is perhaps not too surprising that a member of the Colorado Rockies got the biggest park factor boost with runners in scoring position.
A Last Look at the Players
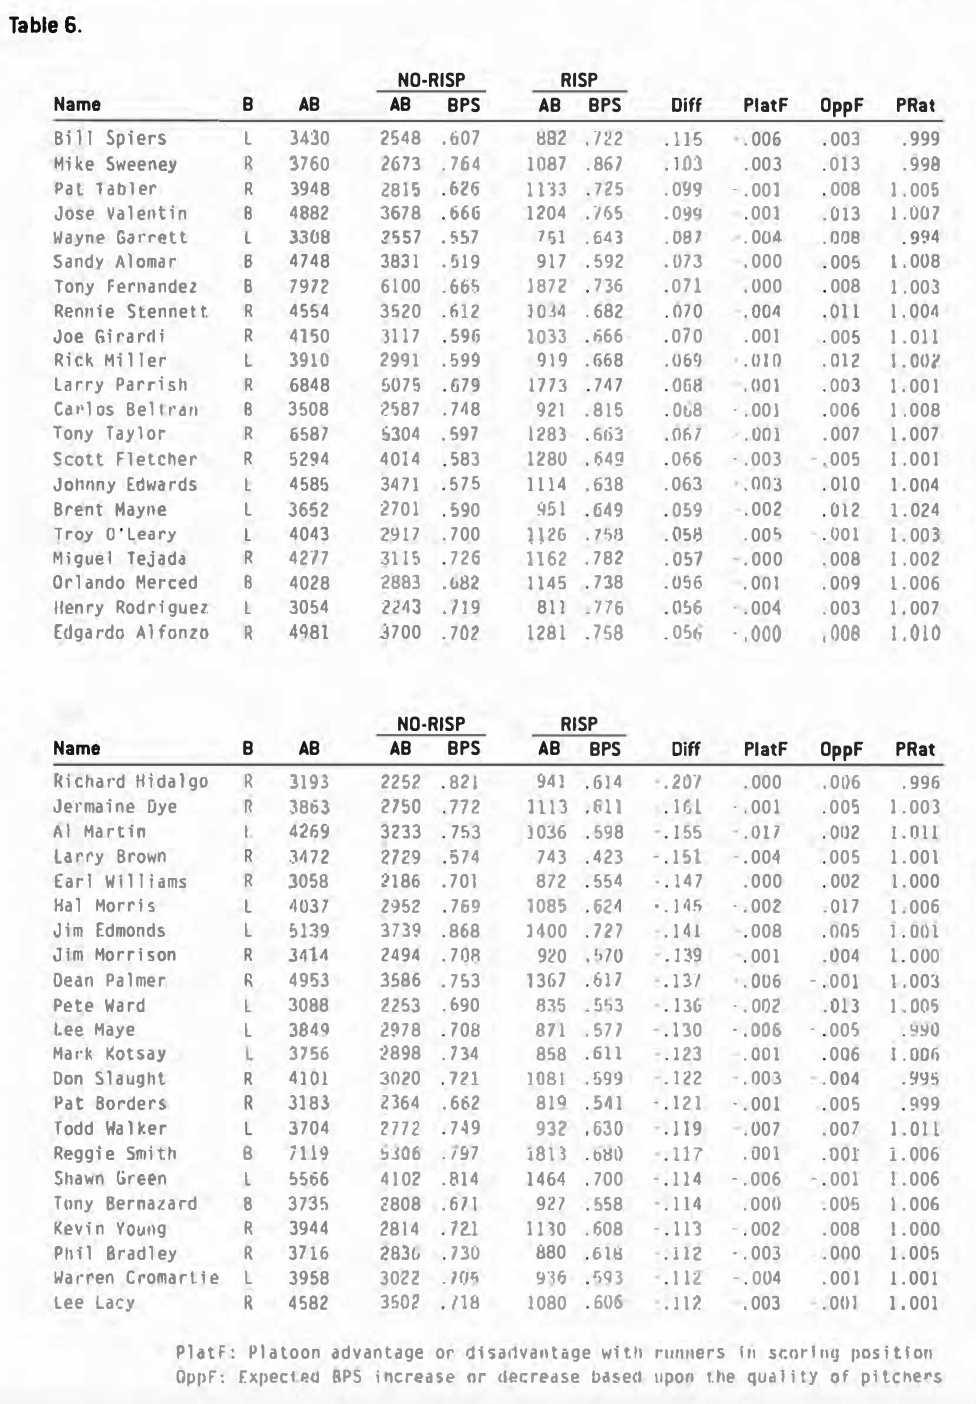
I wanted to take one last look at the players at the top and bottom of our lists, this time with their platoon, strength of opposition, and park factors included.
Some of these hitters (Mike Sweeney, Jose Valentin, Rennie Stennett, and Johnny Edwards) got a bigger than average boost by facing weaker pitchers with runners in scoring position, and Brent Mayne had the advantage of both facing weaker than normal pitching and hitting in these situations in friendlier parks. My feeling is that Mayne would not have been on the list without this help; see Table 6.
It looks like only Al Martin (with a bad platoon factor) and Lee Maye (who seemed to have everything go against him in these situations) could claim to owe their spots on this list to forces beyond their control. Hal Morris, on the other hand, had reasonably good factors and still hit poorly with runners in scoring position.
Conclusion
So did I find evidence of clutch hitting? Not really. I did come up with lists of players who performed well and poorly in this area. Along the way I presented quite a bit of data on situational hitting, platoon advantages, opposition pitching strength, and park effects, and I attempted to both understand and explain what I found. At the end of all this, however, I guess I’m still not convinced that the players owe their inclusion on these lists of mine to talent rather than luck. Even when dealing with sample sizes of several thousand at-bats, the amount of random variation that I found in my simulations was very close to what I found in the real data. As I mentioned before, this doesn’t necessarily mean that there aren’t some real differences buried in all that noise, only that I’m not sure I found them. One could argue that the forces at work here, if they exist, must be awfully weak to so closely mimic random noise, and if they are really that inconsequential, perhaps we could assume they don’t exist without much loss of accuracy.