
“That Record Will Never Be Broken!”: How Many Unbreakable Records Are There?
This article was written by Douglas Jordan
This article was published in Fall 2015 Baseball Research Journal
 Baseball aficionados often argue that certain records will never be broken. A classic example is Cal Ripken’s 2,632 consecutive-games-played streak. However, for the most part, the arguments given to support an assertion that a particular record will never be broken are subjective and not analytically rigorous. The primary purpose of this paper is to examine some baseball records closely in order to increase awareness of the greatness of these feats, and to make a less subjective judgment of any claim that a particular record will never be broken. A secondary purpose is to make fans aware that there are probably more than just one or two baseball records that may never be broken.
Before we look at the records, we must first define what we mean by “never be broken.” Never is a long time. A lot of things we currently think impossible (in baseball and in general) may not be not quite so impossible given eternity as a timeframe. For example, in 2003 it didn’t look like anyone would ever make more than 257 hits in a season since it had been over 80 years since that record was set. But Ichiro Suzuki made 262 in 2004. In 1981 it looked very unlikely that anyone would ever steal more than 118 bases in a season, but Ricky Henderson stole 130 the next season. In addition, the unstated assumption buttressing the “never be broken” argument is that the game of baseball will remain as we know it today. For example, if the mound is lowered again (as Sports Illustrated baseball analyst Tom Verducci suggested in a May 2014 column) in an effort to increase offense, increase attendance, and reduce injuries to pitchers, it will increase the probability of offensive records being broken and decrease the probability of breaking pitching records. Therefore, for purposes of this paper, “never be broken” will be taken to mean the record will not be broken over the next 110 baseball seasons played under rules similar to today’s rules. The time period of 110 years is chosen because the first World Series was played roughly 110 years ago and because some of the records discussed herein only use data from 1903 on. All of the data used to do this analysis were taken from the web site Baseball-Reference.com with the exception of the information included in the endnotes.
Baseline Records Analysis
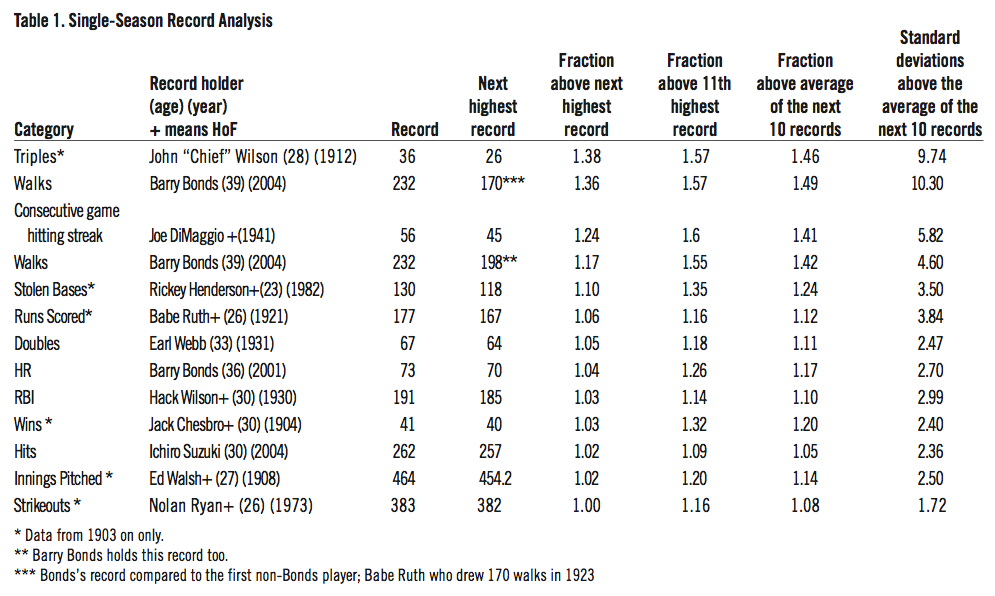
The main point of this article is to examine the “breakability” of various major league single-season and career records. The primary technique used in the analysis will be to compare the records against a standard (and each other) on four separate dimensions.
Although this analysis technique does not yield an actual probability that a record will be broken, it does quantify the discussion of records that are claimed to be unbreakable by allowing records to be ranked on the four dimensions.
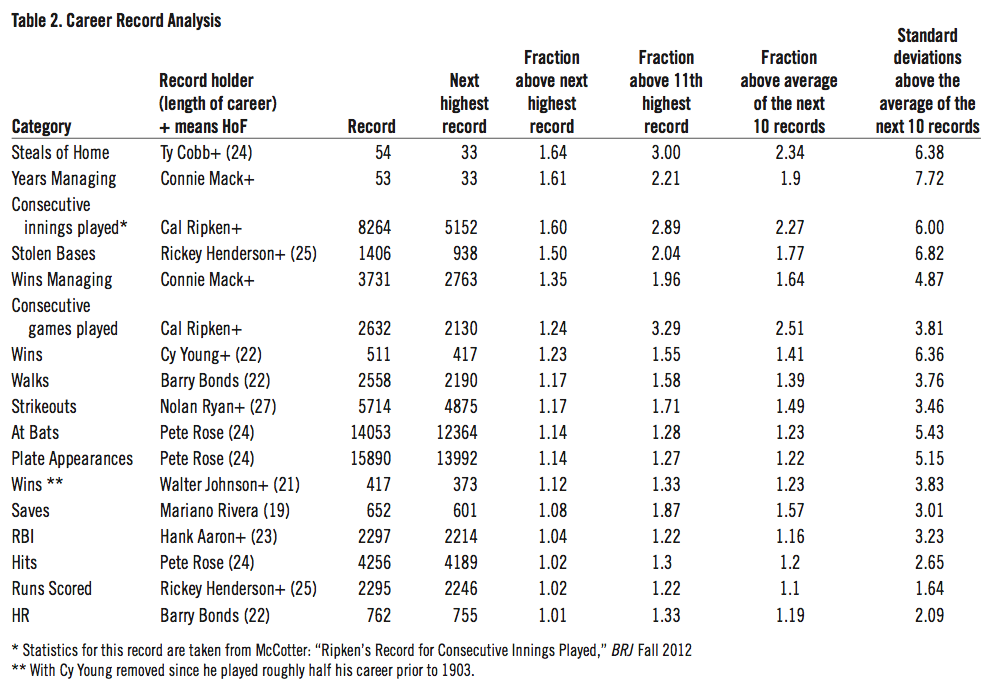
In order to do the ranking it is necessary to have baseline numbers in each of the dimensions for comparison. Therefore, Cal Ripken’s record of 2,632 consecutive games played will be used as the standard against which other records are compared when examining the likelihood of other records being broken. This record is chosen as the standard because it represents over 16 seasons of baseball without missing a game. Although it is possible to play more games consecutively, the probability of any player doing so is so small that there is little question that this record deserves the never-be-broken tag. The numbers associated with the discussion of Ripken’s record in the next paragraph are shown in the sixth line of Table 2.
The following observations can be made based on the calculations associated with Ripken’s record. Records that will be difficult to break are likely to be roughly 20% better than the next highest record, and will be two to three times better than the 11th best record or the average of the next ten records. Such records are also likely to be four standard deviations or more from the average of the next ten records. Cal Ripken also set a related record that is not as widely known as his consecutive games played record. Table 2 shows that Ripken also holds the record of 8,264 consecutive innings played. It took him most of seven straight seasons to play in the 904 games during this streak. This record is just as impressive (and as unlikely to be broken) as his consecutive games played record even if not as widely disseminated. Thanks to Trent McCotter for making me aware of this record in his interesting article in the Fall 2012 Baseball Research Journal, “Ripken’s Record for Consecutive Innings Played.”1
Both single-season and career records will be examined. The records that have been analyzed were subjectively chosen as records that a priori seemed difficult to break. These lists are not intended to be an examination of every possible baseball record. Some of the single-season records only include data from 1903 on. That year was subjectively chosen as the year of the first World Series2, with the pre-1903 data being excluded, because in some respects the game of baseball prior to 1903 is not really comparable to the post-1902 game. For example, according to Baseball-Reference.com, there are 104 pitchers on the single-season innings pitched record list from the 1800s before the first post-1902 pitcher is listed. All of those pitchers threw more than 465 innings during a season, with Will White topping the list with a whopping 680 innings thrown in 1879. The game has changed significantly enough since then that those records are simply not comparable to the post-1902 game and are therefore excluded from the analysis.
 (Click image to enlarge.)
Single-Season Records Discussion: Offense
A careful and thoughtful look at the single-season records in Table 1 reveals that they are all impressive feats. Let’s look at some of them in detail starting with my personal favorite, Rickey Henderson’s incredible 130 stolen bases. Henderson was 23 in 1982 when he set this record. That season he played in 149 games, batted .267 with a .398 on-base-percentage, had 143 hits, and walked a league-leading 116 times. Most of his steals (94) were of second base but he also stole third base 34 times (for perspective, the Kansas City Royals led the majors in steals—153— and steals of third—29— in 2014) and stole home twice. He stole three bases in six games and had three amazing games in which he stole four bases—impressive even if short of the post-1902 record of six in a game done twice by Eddie Collins in 1912 and tied by Otis Nixon (1991), Eric Young (1996), and Carl Crawford in 2009.3 He also stole between 22 and 27 bases every month of the season except September and stole 84 bases over the first 88 games of that season.
Why is this a record that’s not likely to be broken? It’s 12 steals more and about 10% better than the next highest total of 118 bases that Lou Brock stole in 1974 when he was 35(!) years old. In comparison, the recent high for stolen bases is 78 set by Jose Reyes in 2007. Henderson’s record is more impressive on a games-played-per-stolen-base basis. For Henderson, Brock, and Ellsbury these three ratios are 1.15, 1.30, and 2.19 respectively. That means that Henderson needed just over one game for each of his stolen bases (or almost a stolen base per game on average) while the best base stealer in recent times took well over two games for each base stolen. An additional consideration is that given how expensive star players are in today’s game, it is unlikely that a team will allow a star player like Mike Trout, for instance, who led the league with 49 steals in 2012, to take the physical pounding that stealing that many bases would require. Conclusion: it is highly unlikely anyone will ever steal 130 bases again.
What about the hits record? The number is easy to remember; it’s exactly 100 hits more than the number of games in a season, 262. Could that possibly be true? Did Ichiro Suzuki really make 100 more hits than there are games in a season in 2004? Incredibly, he did, but given that he did it only about ten years ago, you might think it’s absurd to consider it a record that might never be broken. But a closer look at Ichiro’s numbers that season will show just how extraordinary getting 262 hits is and why it will be a very difficult record to break even if set relatively recently.
Suzuki broke George Sisler’s 1920 record of 257 hits and Sisler broke Ty Cobb’s 1911 record of 248 hits. The only modern players with at least 240 hits (besides Suzuki) are Wade Boggs and Darin Erstad, who each had 240 hits in one season. These data show that even after adding eight games to the schedule in 1961 (AL) and 1962 (NL) it’s still very difficult to get more than 240 hits in a season. The only modern player to do it is Suzuki, who did it twice (he also had 242 hits in 2001). Sisler’s record had stood for over 80 years before Suzuki broke it.
Why did 257 hits stand so long? Because to accumulate that total Sisler had to play in 154 games, make 692 plate appearances, strike out only 19 times, walk only 46 times, and bat .407 for the season. He made four hits in 12 games, three hits in 29 games, two hits in 33 games, and a single hit in 56 games. He played in only 24 games that season in which he failed to get a hit. In comparison, Adrian Beltre, who led the league in hits in 2013 with 199, had 41 games in which he failed to get a hit.
These numbers show that in order to challenge the hits record, a player has to play in virtually every game of the season, make a very high number of plate appearances, hit for high average, and not walk very much. High average by itself will not get it done. For example, even with the 56-game hitting streak in 1941 and a .357 batting average that year, Joe DiMaggio had only(?) 193 hits that season. Ted Williams only(?) had 185 hits that same year when he batted .406. DiMaggio’s and Williams’s career best hit totals are 215 and 194 respectively.
What are Suzuki’s numbers for 2004? He played in all but one of the Mariners games (161), led the league in plate appearances (762) and batting average (.372), and struck out just 63 times. The 762 plate appearances are eighth on the all-time list, which is topped by Jimmy Rollins’s 778 appearances in 2007. Suzuki had four games in which he made five hits, six games with four hits, 24 games with three hits, 46 games with two hits, 54 games with a single hit, and he failed to get a hit in only 27 games that season. In spite of having such a tremendous season, Suzuki had 251 hits after playing in the same number of games as Sisler (154) and reached that total only because he had a five-hit game and a four-hit game a few games earlier. In subsequent games he made 1, 2, 1, 1, 3 (October 1, the day he broke the record), 1, and 2 hits to get to his total of 262. He made at least one hit in each of the last 13 games of the season for a total of 26. If Suzuki had made only(?) 20 hits in those last 13 games, he would not have broken the record.
The fact that George Sisler’s record of 257 hits stood for over 80 years is a testament to how great his 1920 season was. Ichiro Suzuki needed an equally extraordinary season to break that record. Anything is possible, but a player will have to play in almost every game and have a simply superb season to exceed either of these hit totals. It’s not likely to be done anytime soon, and quite possibly will never be done again.
Hack Wilson’s amazing record of 191 RBIs in 1930 will be examined next. The record is just six better or about three percent higher than the 185 runs that Lou Gehrig drove in in 1931. But it is 26 RBIs better than the modern high of 165 by Manny Ramirez in 1999, so I’m going to compare Wilson’s record to Ramirez’s rather than Gehrig’s. Ramirez played in 147 games, made 174 hits, hit 44 home runs, batted .333, and slugged a league-leading .663. He had eight RBIs in one game and five in another. He had five games with four RBIs, 12 games with three, 30 games with two, and 36 games with one. He failed to drive in a run in just 62 games. Those are superb RBI numbers for single season.
What numbers did Wilson put up in 1930? He played in 155 games, made 709 plate appearances, had 208 hits, batted .356, and led the league in home runs (56), RBIs (191), and slugging (.723, which is 22nd on the all-time list). He had two games with six RBIs, three games with five RBIs, seven games with four RBIs, 15 games with three RBIs, 26 games with two RBIs, 39 games with a single RBI, and 63 games with none. He drove in nine runs in the last three games of the season and 12 runs in the last five games. These are amazing RBI totals. In order to generate that many, he had to have men on base to drive in. Woody English and Kiki Cuyler batted in front of Wilson that season and had OBAs of .430 and .428 respectively. It’s rare to have a pair of teammates with OBAs that high. Wilson’s 191 RBIs in 1930 is an astounding record that will most likely never be broken. (Zach Rymer wrote an interesting article about Wilson’s record in 2013 for Bleacher Report.4)
The next two players on the RBI list are Lou Gehrig and Hank Greenberg. Historically, Gehrig had been credited with 184 in 1931 and Greenberg with 183 in 1937. But research by Herm Krabbenhoft corrected Greenberg’s total to 184 (BRJ Spring 2012)5 and Gehrig’s to 185 (BRJ Fall 2012)6.
Space considerations preclude a detailed discussion of all the single-season hitting records in Table 1, but a couple other records deserve to be mentioned. Taking the numbers at face value (setting aside the discussion of how steroids should or should not be considered with respect to records) means that Barry Bonds’s astounding 232 walks in 2004 is very unlikely to ever be broken. The next highest total on the walks list is 170 by Babe Ruth in 1923. The only player to exceed 170 is Bonds, who did it three times between 2001 and 2004. The next highest total is 162 set by Mark McGwire (1998) and Ted Williams (1947 and 1949). Since no player but Bonds has ever exceeded 170, Bonds’s 232 walks is likely to stand a very long time. The same is true of John “Chief” Wilson’s record 36 triples in 1912. That record is 38% better than the next highest post-1902 total (26) and 46% better than the average of the next ten. The modern high for triples is Curtis Granderson’s 23 in 2007, with most years having a high well under 20 triples. The Pirates home ballpark in 1912, Forbes Field, probably had something to do with Wilson’s total. With an incredible 462 feet to the center field wall, the 1912 Pirates hit the most triples (129) since 1902.7 Wilson said of his record, “A three-base hit may usually be made only by driving the ball clear to the fence, particularly toward center field on most grounds.8” Whatever the cause of Wilson’s outburst, nobody is likely to hit 36 triples again anytime soon.
Single-Season Records Analysis: Pitching
Before discussing specific pitching records, it is appropriate to examine changes in pitching in general over the last century or so. Changes such as going from a four-man rotation to a five-man rotation in the mid-1970s and the increased use of relief pitchers since the 1980s have resulted in a general trend of using more pitchers who pitch fewer innings over time. These changes have substantially reduced the number of innings pitched by starting pitchers, which in turn has reduced the number of decisions awarded to starting pitchers. This makes it highly unlikely that pitching records set in the early 1900s will ever be broken unless the use of pitchers changes substantially in the future.
The arguments in the previous paragraph apply to both the innings pitched and wins records in Table 1. Ed Walsh pitched an incredible 464 innings in 1908 and Jack Chesbro had an amazing 41 wins in 1904. To achieve that innings pitched total, Walsh started 49 games and completed an astonishing 42 of them while compiling a 40-15 overall record. He appeared in 66 games and had six saves. Chesbro started 51(!) games and had 48(!) complete games on his way to a 41-12 season and a total of 454 innings pitched. All of these totals are impossible to achieve in today’s game, since starting pitchers have a maximum of about 35 starts during a season.
But what about a pitching record that is only about 40 years old rather than 100 years old? Does the same logic apply? For example, Nolan Ryan struck out an astonishing 383 batters in 1973. This total is just one strikeout more than the second highest total (Sandy Koufax’s 382 in 1965) but is 16% higher than the 11th highest record. Ryan started 39 games, completed 26 of them, pitched 326 innings, and had a 2.87 ERA. He finished with a record of 21-16 and also walked a league-leading 162 batters. He averaged 10.6 strikeouts per nine innings over the course of the season. He struck out 17 batters in one game and 16 in another. He also had an incredible total of 23 games with double-digit strikeouts.
Since both Ryan and Kofax pitched in a very different pitching era from today, it might be tempting to say this is a record that will never be broken. But the third-place record on the list is just 11 strikeouts fewer than Ryan’s total and was put up a little over a decade ago. Who did it? Randy Johnson. The Big Unit struck out an amazing 372 batters in 2001 when he went 21-6 with a 2.49 ERA. It’s interesting to note that he threw 249 innings and had a 2.49 ERA that season. He threw three complete games in 34 starts. How did he accumulate almost as many strikeouts in about 80 fewer innings? Johnson struck out an incredible 13.4 batters per nine innings that season (the best- ever ratio for strikeouts per nine innings; he holds six of the top eight in that category). He struck out 20 batters in one game and 16 batters in three other games. Like Ryan, he had double-digit strikeouts in 23 of his starts. With strikeout numbers like that, it is not surprising he approached Ryan’s record that season.
So does Johnson’s accomplishment mean that Ryan’s record does not belong in the never-be-broken category since Johnson approached it relatively recently? In spite of Johnson’s heroic efforts, it is very unlikely that anyone will exceed 383 strikeouts in a season. Johnson had a season for the ages in terms of strikeouts in 2001 and still did not break the record. The next two recent pitchers on the season strikeout list (who are not Ryan, Koufax, or Johnson) are Sam McDowell, who struck out 325 in 1965, and Curt Schilling, who struck out 319 in 1997. Those still impressive strikeout totals are a far cry from 383. The numbers show that Ryan, Koufax, and Johnson were very special pitchers in terms of strikeouts. Even in the current era with batters striking out at historic rates, it will take an extraordinary effort over the course of a season to exceed either Johnson’s or Ryan’s total. So in spite of how recent Johnson’s effort is, as with Ichiro Suzuki’s recent 262 hits in a season, 383 strikeouts may never be broken.
What about Joe DiMaggio’s record 56-game hitting streak? This record enjoys iconic status and the numbers in Table 1 associated with this record are similar to the numbers associated with Chief Wilson’s record 36 triples. The similarities of the numbers for the two records implies that the hitting streak record deserves its iconic status. However, Wayne Winston in his 2009 book Mathletics argues that the breakability of this record is primarily a function of the overall baseball batting average.9 He argues that as league batting averages move upward, the probability of a 56-game hitting streak increases. To be specific, Winston finds that there is a 2.4% probability of a 56-game hitting streak over 107 seasons. He concludes, “Our calculations show that given all the opportunities for a 56-game hitting streak to occur, such a streak is highly unlikely, but certainly not impossible.”
Career Records Discussion: Offense
Career records are analyzed in the same manner as the single-season records. The results are shown in Table 2.
 (Click image to enlarge)
A thoughtful examination of the records in Table 2 can elicit only one response: wow! All of the career records are amazing! With the sole exception of the saves record, every one of them required over 20 years of sustained, superior performance. Given the magnitude of the accomplishments in Table 2, it’s not unreasonable to consider that none of the career records may ever be broken. Let’s look at some of them in detail, starting again with stolen bases.
Rickey Henderson’s career total of 1,406 stolen bases is simply incredible. It is 468 stolen bases and 50% better than Lou Brock’s second place (and still impressive) total of 938. Just how big is that difference? There are only 45 players on the career stolen base list who have more than 468 stolen bases (however a stolen base is defined) in their whole career. Henderson has that many more than Brock. The top mark for players who are currently playing is Ichiro Suzuki’s 498 (as of this writing) career total. Recent season highs for stolen bases have been around 70. That total would have to be achieved for 20 years in order to get to Henderson’s total. Is that possible? Yes. Is it likely? No.
How did Henderson do it? He needed extraordinary longevity, durability, and performance. During his 25-year career (an amazing career length given how stealing bases punishes the body and can result in injury) he led the league in steals 12 times, stole over 100 bases three times, stole between 77 and 93 bases four times, and between 41 and 66 bases nine times. He played in over 100 games in all but five of his seasons while maintaining a career .279 batting average and a .401 career OBP. Henderson achieved such a high career OBP by walking a lot. In fact, as Table 2 shows, his 2,190 career walks is second only to Barry Bonds’s 2,558. In comparison, Lou Brock, who played for 19 years, led the league in steals eight times, had a single season with over 100 steals, and just two other seasons with 70 or more steals. He batted .293 lifetime and had a career OBP of .343. Those are impressive numbers but a far cry from Henderson’s. Brock’s record may be broken, Henderson’s is virtually unreachable.
Table 2 also shows that Henderson leads the career list for runs scored with 2,295. Although this total is just two percent above the 2,246 put up by Ty Cobb, it is still a very impressive total. Henderson’s seasonal runs scored numbers need to be considered in the context of recent performances to be fully appreciated. The recent high for runs is the 152 put up by Jeff Bagwell in 2000. The seasonal high has been in the 120–140 runs scored range recently. What did Henderson do? He scored more than 100 runs 13 times with his high being 146 in 1985, and scored at least 118 runs in four other seasons. He scored at least 40 runs every other season except for his shortened last season. How likely is this record to be broken? The next players on the career runs scored list after Cobb are Barry Bonds with 2,227 and Hank Aaron with 2,174. If they couldn’t do it with their outstanding careers, it’s going to be very difficult for anybody else to break this record.
 Arguably, the numbers 714 and 755 are the most famous figures in baseball history. Even casual baseball fans are likely to know that these are Babe Ruth’s and Hank Aaron’s career home run totals. It is also widely known to current baseball fans that Barry Bonds broke Aaron’s record in 2007 and amassed a total of 762 home runs in his career. Baseball fans tend to throw these numbers around casually, but it must be understood that for anybody to hit more than 700 home runs in a career is incredible. It takes 14 seasons with 50 home runs or 17.5 seasons of 40 home runs to reach 700. Hitting 50 home runs in a season is quite an achievement; only 27 different players have done it a total of 43 times. Even at the height of the steroid era there were only two years (1998 and 2001) where four players hit 50 or more home runs. In that same era there were only seven years where the top ten totals for home runs were at least 40. So 40 home runs, even in a hitter’s era, is still a special achievement. That means all three of the men who have hit over 700 career home runs had very rare careers.
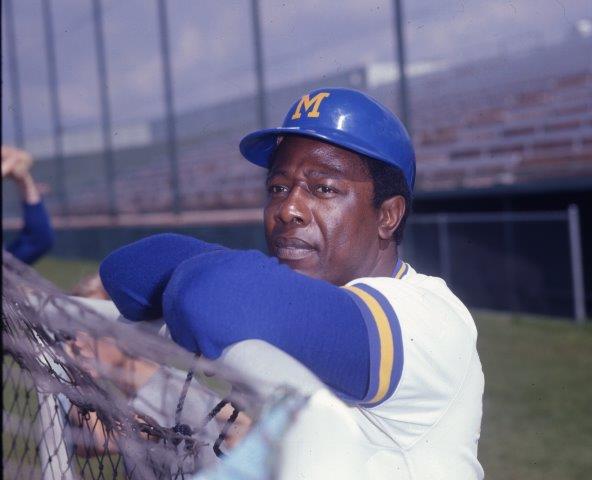
I’m going to focus on Hank Aaron’s career because of sentiment like the following. I heard Bob Costas on a national TV broadcast in August 2014 say something like, “Everybody knows Hank Aaron holds the true career home run record.” Bonds needed to hit his very controversial 73 home runs in 2001 to even have a chance at 755. Aaron’s stellar career numbers are untainted. Hammerin’ Hank’s career home run numbers over the course of his 23-year career are nothing short of awe-inspiring. Even though he never hit 50 home runs in a season, he hit 40 or more home runs eight times, with a career high 47 in 1971, 39 home runs in two other seasons, and 38 in another. In four other seasons he hit 30 or more, and 20 or more in five other seasons. That means he hit 20 or more home runs in all but three of his seasons, the first and last two (13,12,10 home runs respectively) being the exception. He was able to hit that many because of his incredible durability. He played in at least 120 games in all but two of those 23 seasons, which resulted in 13,941 plate appearances (third on the career list) and 12,364 at bats (second on the career list).
Aaron’s numbers are impressive (and I believe generally underappreciated) but it would be inappropriate to discuss the career home run record without at least mentioning Babe Ruth. Ruth’s career high of 60 home runs in 1927 is fairly well known. But what may be less widely recognized is how far ahead of his peers Ruth was in terms of home run production. In his first season with the Yankees, 1920, Ruth hit 54 home runs. This total is almost triple the next highest of 19 that George Sisler hit that season and is more home runs than every other team except the Philadelphia Phillies hit that year. The following season Ruth hit 59 with the next highest total being 24. In addition to those three stellar seasons Ruth had a fourth 50-plus home run season in 1928 when he hit 54 again. Only two other players, Mark McGwire (70, 65, 58, 52) and Sammy Sosa (66, 64, 63, 50) have had four 50 or more home run seasons. Ruth also hit 40-plus home runs in seven other seasons and had between 22 and 35 home runs in five additional seasons. The fact that his career total of 714 has been exceeded does not diminish the magnitude of his home run accomplishments. It should also be noted that his career total would likely be higher had he not started out as a (very good) pitcher.
Two more points about the home run record. Willie Mays hit 660 home runs lifetime. But he missed most of 1952 and the entire 1953 season due to military service. He hit 41 and 51 home runs during the 1954 and 1955 seasons respectively. It is not unreasonable to argue that he could have exceeded 700 if he had not missed the majority of those two seasons. Finally, are there any current players who can challenge Bonds’s total of 762? As of this writing Albert Pujols is 35 years old and has 554 home runs. He needs 208 more home runs to tie the record. Assuming he plays until he’s 41 (six more seasons) he would need to hit about 35 home runs per season to get to 762. The last six seasons he’s hit 42, 37, 30, 17, 28, and 34 (to date in 2015) home runs. Given these totals for the last six years, it appears he has an outside chance to hit 762 if he can stay healthy and continue to perform at the highest level. He’s probably not going to get there but it’s not impossible. Alex Rodriguez has an impressive 682 home runs lifetime (to date in 2015). He needs to hit another 80 home runs to tie the record. But he turned 40 during the 2015 season and even having a noteworthy comeback season in 2015 has 28 home runs (to date). He needs to have three more seasons of that type of production to approach the record. If he plays another season or two he will probably exceed 700 career home runs, but it’s not very likely he’ll get to 762.
Let’s move on to the career RBI record. It’s an interesting coincidence that Rickey Henderson’s career total of 2,295 runs scored is almost the same number as the record 2,297 career RBIs set by Henry Aaron. This total is about three percent higher than Babe Ruth’s second-place total of 2,214. Perhaps it’s not surprising that the men with the highest career home run totals are also the men with the highest career RBI totals (Barry Bonds is fourth on the list with 1,996) but that fact doesn’t diminish these accomplishments. Aaron’s RBI numbers are a model of consistent superior performance. He reached 118 or more RBIs in nine seasons with a career high of 132 in 1957. He had two other seasons with over 100 and seven other seasons with between 86 and 97. To put these numbers in perspective, during the recent hitter’s era, there were just six years (1996-2001) where the tenth highest RBI total for the season exceeded 118. In every other season since 1936 Aaron’s 118 (at least) RBIs would have been in the top ten in the league. The inevitable conclusion: this is another record that will be very difficult to break.
As an aside, research for this article has led me to conclude that Hank Aaron is underappreciated historically. Discussions about the best players from his era tend to focus on Willie Mays and Mickey Mantle. Aaron’s career accomplishments exceed both of those great players. He is first on the career RBI and total bases list, second on the career home run and at-bats list, third on the career hits, plate appearances, and games played list, and fourth on the career runs scored list. Mays is third on the career total bases list, fourth on the career home run list and seventh on the career runs scored list. To be fair, Mays missed an entire season (1953) in his prime due to military service and Mantle’s career numbers were reduced due to injury. Even so, I believe Hank Aaron does not get the recognition he deserves for his all-around outstanding abilities.
The number 4,256 is another famous baseball number. It’s the record number of hits that Pete Rose had in his stellar career. This is another figure that gets thrown around a lot without being fully appreciated. To amass a total of 4,000 hits a player has to make 200 hits a year for 20 years! And even though 200 hits is a long way from the 262 that Ichiro Suzuki had in 2004, a player who makes 200 hits is always recognized as having had a great season. To emphasize how rare it is, the last season with the top ten players all making more than 200 hits was 1937. There are some seasons where no player gets 200 hits. This is why there are only two players who have more than 4,000 career hits, Rose and Ty Cobb with 4,189. Ichiro Suzuki’s career total for hits is 4,201 if you add the 1,278 hits he had during his first nine seasons in Japan to the 2,923 hits (to date in 2015) he has in the U.S. This impressive total is just more evidence that he’s one of the best hitters to ever play the game, even if the Japanese hits are discounted slightly due to weaker pitching.
How did Charlie Hustle do it? First, he had a 24-year career with extraordinary durability. He played in at least 148 games in all but five of those seasons. This durability combined with a career .303 batting average resulted in ten seasons with more than 200 hits and a high of 230 hits in 1973. He batted at least .311 in all ten of those seasons. He had three other seasons where he made more than 190 hits and seven additional seasons with between 139 and 185 hits. Since he started his career in 1963, he achieved these totals while playing at least part of his career in what is recognized as a pitchers’ era. The magnitude of Cobb’s achievement of 4,189 hits can be seen by the fact that Rose needed almost every one of his hits to break Cobb’s record. Rose broke the record on September 8, 1985, on his way to a 107-hit season, and had just 52 hits in his last season of 1986. It’s arguable that Rose would not have gotten so many hits if he had not had Cobb’s record to shoot at10. This is another record that is virtually unbreakable. For example, as great as Derek Jeter’s 20-year career was, his 3,465 career hits are almost 800 shy of the record.
Rose’s extraordinary durability and longevity puts him at the top of career lists in three other categories. He played in the most games (3,562), made the most plate appearances (15,890), and had the most at bats (14,053) of any player. All three of these numbers are extraordinary and could be analyzed in a manner similar to the hits record, but I’m going to do a brief analysis of just the plate appearances record to make the point. The 15,890 plate appearances in 24 years are astounding. This is an average of about 636 plate appearances for 25 years or roughly 795 plate appearances for 20 years. How many plate appearances did Mike Trout (arguably the best young player in the game today) have in his first three full seasons? He had 639, 716, and 705 in 2012-2014. Trout will have to put up similar numbers for another 20 years to get close to the record. Is that possible? Yes. But injuries could easily lower season totals or shorten his career, making it very unlikely that he (or anybody else) will reach Rose’s total. One last point about Pete Rose. His lifetime ban from baseball for gambling does not diminish the magnitude of his on-field accomplishments.
Career Records Discussion: Pitching and Managing
 Now let’s look at the career strikeout record. Nolan Ryan pitched for 27 years (how is that possible!) and accumulated an astounding total of 5,714 strikeouts. No one else even has 5,000 career strikeouts. Second place is held by Randy Johnson with 4,875. Ryan’s record is an amazing 17% better than Johnson’s total. How did he get to 5,714? Ryan struck out over 300 batters in six separate seasons with his three highest totals being 383, 367, and 341. He struck out at least 200 batters in nine other seasons. And in addition to those years, he had nine other seasons with at least 125 strikeouts. Those are simply incredible strikeout totals. Johnson also struck out 300 batters in six seasons but comparing Ryan to the third place pitcher on the career list will put Ryan’s accomplishments in better perspective.
Roger Clemens retired in 2007 after 24 seasons. Clemens won the Cy Young award seven times and was known for being a strikeout pitcher. He led the league in strikeouts five times and is third on the career list with 4,672 strikeouts. How do his seasonal totals compare to Ryan’s? Clemens did strike out at least 200 batters in twelve seasons (a very impressive statistic) but his best two totals were 292 and 291. The third best strikeout pitcher in history never had a 300 strikeout season but Ryan (and Johnson) did it six times. Here’s another way to look at it. A total of 5,714 strikeouts requires an average of about 229 strikeouts per year for 25 years or about 286 strikeouts per year for 20 years. To put those numbers in recent perspective, the 2013 league leader was Yu Darvish with 277 strikeouts (Ryan exceeded that strikeout total six times), and only three pitchers had more than 228 strikeouts (Ryan exceeded that strikeout total 10 times) in 2013. Can Darvish strike out 280 men each year for the next 20 years? Unlikely, and maybe impossible. For example, Darvish was injured in 2014 and struck out 182 men that season. Ryan’s career strikeout total is another record that is virtually unattainable.
What about the career record for wins? Here’s a number that can be said with certainty to not be breakable without drastic changes in how pitchers are currently utilized or changes to how wins are awarded. The numbers associated with Cy Young’s 511 wins and the 417 wins that Walter Johnson put up in the purely post-1902 era are almost inconceivable by today’s standards. Young got his total by winning over 30 games in five seasons and over 20 games in 10 more seasons. He started 40 or more games in 11 of those seasons. Johnson won over 30 games twice and at least 20 games in 10 other seasons. He started at least 36 games in nine seasons with two seasons of 40 and 42 starts. All of these numbers are impossible to reach today. The best that modern pitchers have managed to do in terms of wins is the still very impressive 355 that Greg Maddox won during his 23-year career and the controversial 354 wins put up by Roger Clemens. To get to 400 wins a pitcher would have to win 20 games a year for 20 years. That’s virtually impossible with just 35 starts per year. Young’s record will never be broken.
I’d bet that most baseball fans have at least heard of Connie Mack. But if they’re like me (before the research for this article) they probably don’t know why he’s famous. All Mack did is manage for 53 years and win 3,731 games in the process! Second on both lists is John McGraw who managed for 33 years and won 2,763 games. Mack also holds the record for games managed (7,755) and for losses (3,948). This is not the appropriate venue for a complete biography of Mr. Mack. But in brief; he managed the Philadelphia Athletics for 50 years from 1901 until the end of the 1950 season. His teams won five World Series titles and nine American League pennants. He was elected to the Hall of Fame in 1937.
What is germane to this article is the fact that it is highly unlikely that any of Mack’s records will ever be broken. The second longest tenure is 20 years shorter and the second most wins is almost 1,000 fewer. It should be noted however, that some of the longest lasting and winningest managers in baseball history have been active recently. Tony La Russa managed for 33 years and won 2,728 games. Bobby Cox had 2,504 wins in 29 years, and Joe Torre won 2,326 games during his 29-year career. These three men are third, fourth, and fifth on the career wins list. Here is one final (and astounding) non-playing field related statistic. Vin Scully has been (and continues to as of this writing) broadcasting Dodger baseball since 1950 when he was 22 years old. Do the arithmetic yourself. Scully’s broadcasting tenure is another incredible record that will be almost impossible to break.
Conclusion
This paper was written to convey three main points. The first is simply to make the reader more aware of some of the incredible feats performed in baseball history. The second is to look at the stock phrase “never be broken” in a more serious manner. It is easy to make such a claim in casual conversation, but do the data support any such assertion? The third is to make baseball fans aware of just how difficult it will be to break the records listed in Tables 1 and 2.
So what is the answer to the title subheading? How many records will never be broken? The answer: probably lots of them! It’s arguable that some of the single season records are more likely to be broken than the career records since a player “only” needs a single outstanding season to do so. In spite of that rationale, I’d bet that Henderson’s stolen base record (130), Wilson’s triples record (36), and Bonds’s walk record (232) will not be broken in the next 110 years. Hack Wilson’s 191 RBIs and Ichiro Suzuki’s 262 hits are also very unlikely to be exceeded. Current trends in pitching mean that the post-1902 innings pitched record (464) and wins record (41) will not be broken. Since Randy Johnson recently came within 11 strikeouts of Nolan Ryan’s season strikeout record of 383, I suppose it’s possible for another pitcher to break Ryan’s strikeout record. But I doubt it will happen. What about the career records? Frankly, it’s hard to imagine any of the records in Table 2 being broken. It’s possible that Alex Rodriguez or Albert Pujols could break the career home run record of 762 but it’s very unlikely. A similar argument can be made for the rest of the career records. The final conclusion: many existing baseball records may never be broken.
DOUGLAS JORDAN is a professor at Sonoma State University in Northern California where he teaches corporate finance and investments. He’s been a SABR member since 2012. The article “That Record Will Never Be Broken!” is his second contribution to the BRJ. He runs marathons when he’s not watching or writing about baseball. You can contact him at douglas.jordan@sonoma.edu.
Acknowledgments
I sincerely thank three anonymous peer reviewers for their insightful comments and suggestions. Their input resulted in a much better paper. I also need to thank Clifford Blau for his meticulous fact checking. The paper is more accurate because of his rigorous attention to detail.
Notes
1 Trent McCotter, “Ripken’s Record for Consecutive Innings Played,” Baseball Research Journal, 41 (Fall 2012): 7-9.
2 Post-season games prior to 1903 were considered exhibitions.
3 These stolen base records are taken from the Baseball Almanac web site: http://www.baseball-almanac.com/recbooks/rb_stba.shtml.
4 Bleacher Report, http://bleacherreport.com/articles/1645610-why-hack-wilsons-rbi-record-is-impossible-to-break-in-todays-mlb.
5 Herm Krabbenhoft, “Hank Greenberg’s American League RBI Record,” SABR Baseball Research Journal, 41 (Spring 2012): 20–27.
6 Herm Krabbenhoft, “Lou Gehrig’s RBI Record: 1923-1939,” SABR Baseball Research Journal, 41 (Fall 2012): 10-13.
7 The Wikipedia entry for Forbes Field contains the following: Barney Dreyfuss (owner of the Pirates) “hated cheap home runs and vowed he’d have none in his park”, which led him to design a large playing field for Forbes Field. The original distances to the outfield fence in left, center, and right field were 360 feet (110 m), 462 feet (141 m) and 376 feet (115 m), respectively. The web site is: https://en.wikipedia.org/wiki/Forbes_Field.
8 Quoted from Mark Armour’s article on Wilson in the SABR Baseball Biography Project: The specific web site is: http://sabr.org/bioproj/person/ed5711f8.
9 Wayne L. Winston, Mathletics: How Gamblers, Managers, and Sports Enthusiasts Use Mathematics in Baseball, Basketball, and Football (Princeton, New Jersey: Princeton University Press, 2009).
10 His career hit total was also likely increased because he was filling out the lineup card as player/manager for the Reds in 1985 and 1986.