

The Best and Worst Batteries: Comparing ERAs 1960-2004
This article was written by Chuck Rosciam
This article was published in 2005 Baseball Research Journal
Sometimes a pitcher and a catcher (battery) come together as a fully charged duo outperforming all other battery combinations for either player. In some cases the result of this pairing has been a full point or more below both the pitcher’s and the catcher’s individual ERA. On the other hand, the battery can fall a little short on electricity and the result is a pairing of a full point worse than either’s ERA. A study was undertaken to ascertain which batteries were the best and which ones were the worst using comparative ERAs as the measure on both a seasonal and a career basis.
Using Retrosheet “Event Files” for the years 1960-2004, the Earned Run Average for every battery combination (BERA) was computed by counting every inning-out and every earned run attributable to the battery. The ERA for the pitchers (PERA) was then tabulated for all of their catchers and the same was done for the catchers paired with all of their pitchers (CERA), for each season and in total for the data period (identified as career). For each of the specific battery combinations, their BERA was subtracted from both the pitcher’s and the catcher’s ERAs. The resultant above/below numbers were then averaged to determine which batteries performed better or worse than both player’s individual season or career ERA.
Some Numbers
There were a total of 55,938 different battery combinations in the data set of the forty-five years analyzed. In the career (total) summary group there were 36,060 such pairings involving 3,768 different pitchers and 780 different catchers. Because some of these pairings were only for 1/3 of an inning while others were for more than a thousand innings, a minimum inning of pairing was established. The criteria used for the analysis was 75 innings per year (seasonal) or 250 innings (career) paired as a battery. In addition, the battery’s seasonal or career innings could not exceed 75% of the pitcher’s total innings for the season or career nor could the comparative batteries be below 75 innings per year (or 250 innings career). This criteria was used so that there would be a meaningful comparison with other match-ups and that the one or two season anomalies would not be included. These minimums reduced the number of battery combinations to 2,039 (seasonal) and 1,093 (career), which meant that the pair generally worked together for about a half of a season or for two to three years.
The data period represented 1,605,600 2/3 total defensive half innings and 690,938 earned runs for a baseline ERA of 3.87. The National League during this period had an ERA of 3.76 with 331,013 earned runs in 791,738 innings that involved 2,589 different pitchers and 539 different catchers. The American League had an ERA of 3.98 with 359,925 earned runs in 813,9522 2/3 innings using 2,752 different pitchers and 548 different catchers. There were 38,954 batteries where the pitcher was right handed for a BERA of 3.90 and there were 16,984 batteries involving a left-handed pitcher who had a BERA of 3.94.
The single season high for most innings paired belonged to Wilbur Wood and Ed Hermann of the White Sox in 1972 when they joined for 353 1/3 innings. Their BERA was 2.50 just slightly better than Wilbur’s seasonal 2.51 PERA. Five batteries (out of 55,951) had 300+ innings in a year while 407 had 200+ innings and 725 had just 1/3 of an inning. The highest number of career innings paired belonged to Bill Freehan and Mickey Lolich with 2,331 1/3. Gary Carter and Steve Rogers came in second with 1,982 1/3. Forty-nine batteries (out of 36,063) had 1000+ innings together in their career; 329 batteries had 500+ innings and 470 teamed up for only 1/3 of an inning.
The Best Batteries
Who were the best batteries using this Combo Earned Run Average methodology? Taking just the pitchers’ career ERA compared to the specific battery’s ERA found that 12 batteries had a BERA of two or more runs better in the data set. For the catchers’ career ERA bumped against the specific battery’s ERA the results showed just one battery that performed better by two or more runs. By averaging the two above/below ERA comparisons, the study identified 52 batteries that were at least one full point better. Who were these phenomenal batteries?
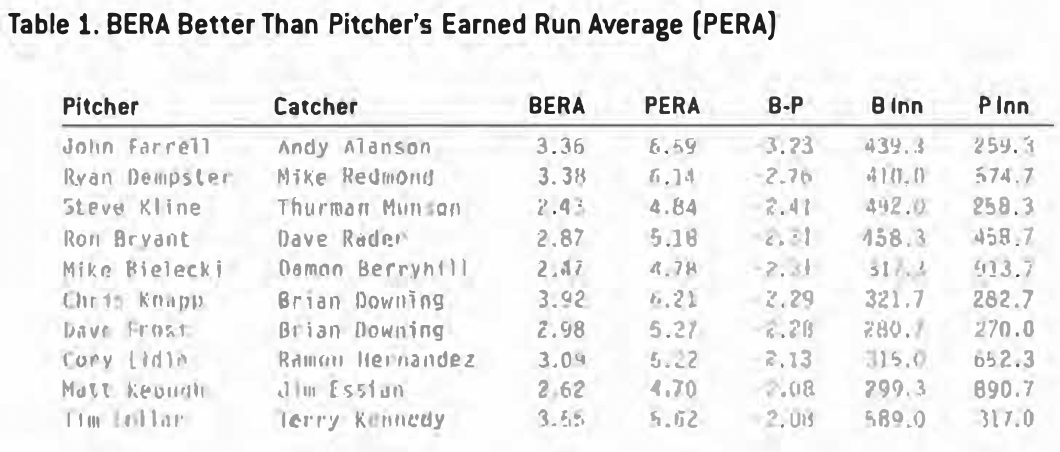
First, we’ll look at the career batteries (BERA) compared to just the pitchers’ numbers (PERA). The very best duo was pitcher John Farrell and catcher Andy Allanson. In over 439 innings together they had a BERA of 3.36 compared to Farrell’s career of 6.59 in 259 other inning pairings which is a difference of -3.23, or more than three runs better. Coming in second place was the team of Ryan Dempster and Mike Redmond who had a BERA-minus-PERA of two plus runs better at -2.76 in 410 innings. Table 1 shows the Top Ten in this analysis.
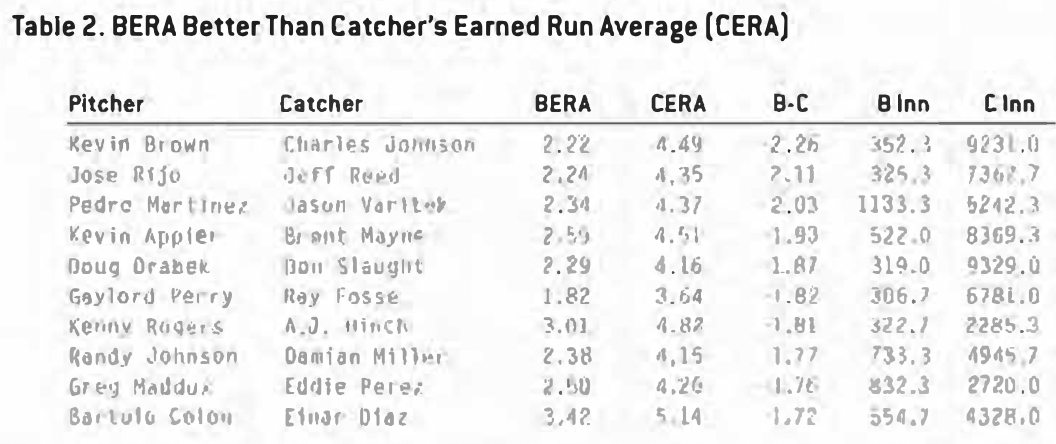
By comparing the battery’s ERA to the catcher’s earned run average (CERA), the top ten list has a complete turnover (See Table 2). The very best pairing was with pitcher Kevin Brown and catcher Charles Johnson for a BERA of 2.22 with a differential of -2.26 or two runs better than Johnson’s career CERA of 4.49. Second place belonged to the tandem of Jose Rijo and Jeff Reed with a -2.11 differential.
The last step in the Best Combo Earned Run Average approach is the averaging of the two previous comparisons. This produces the best of both perspectives (BERA is better than both the PERA and the CERA). See Table 3 for the Top Ten Career Rankings and Table 4 for the Ten Best Seasons.
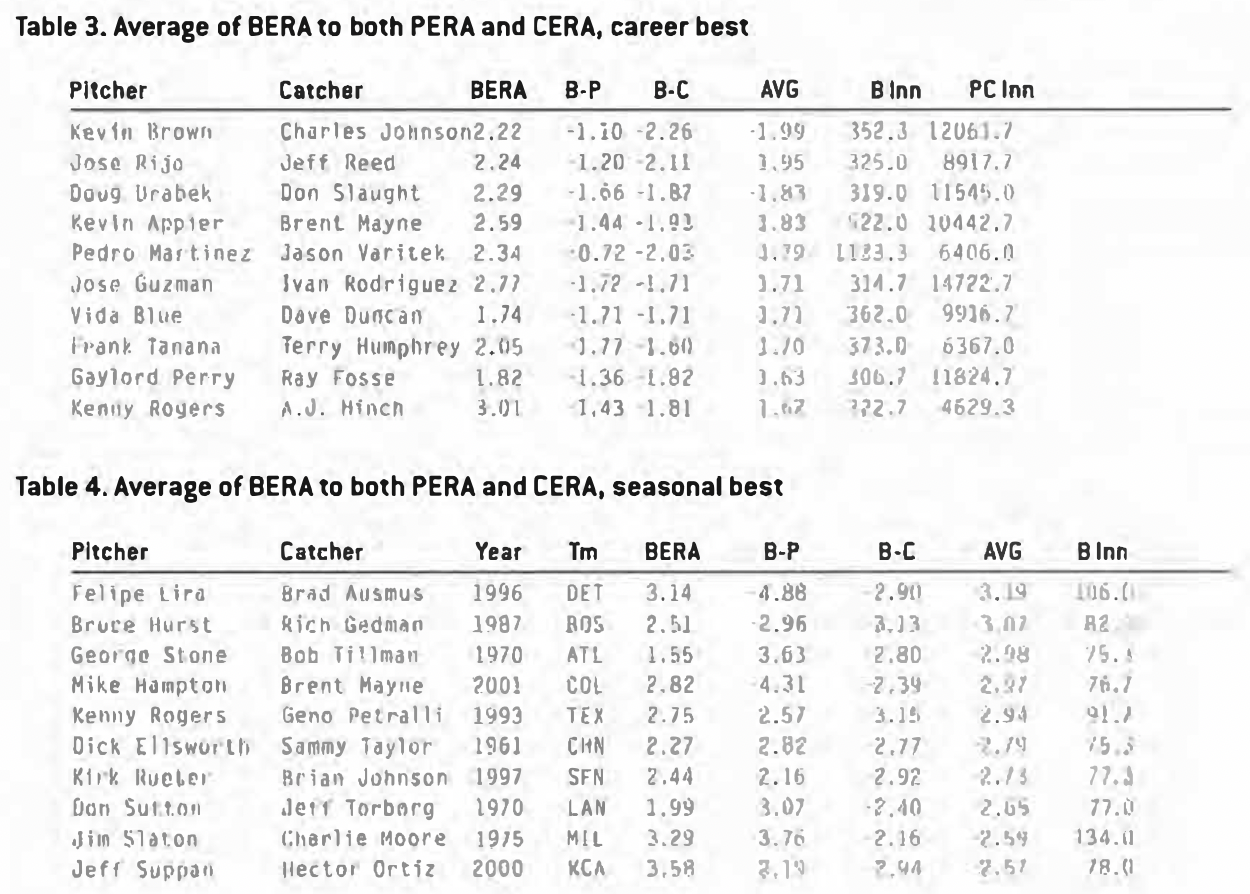
The very best career pairing – the two guys with the best performance together – were Kevin Brown and Charles Johnson. They came together for 352 innings and produced a BERA of 2.22, which on average was nearly two full runs below their individual earned run averages (PERA = 3.32 and CERA = 4.49). Coming in at a very close second in the averaging ranking were the twosome of Jose Rijo and Jeff Reed whose differential was -1.95 with a BERA of 2.24.
In the Best Combo ERA for a Season the winners were pitcher Felipe Lira and catcher Brad Ausmus. In 1996, while playing for Detroit they had a BERA of 3.14 in 106 innings which was, on average, -3.19 better than their individual ERA’s that year. They were one of only two seasonal batteries in the qualifying 2,039 pairings that had on average three or more runs better than any other pairings.
The lowest BERA for a season (minimum of 75 innings paired) was recorded by Bob Gibson and Johnny Edwards in 1968 with St Louis for a phenomenal 0.89 in 91 innings. Gibson’s PERA that year was 1.12. Gibson tearned up with catcher Tim McCarver that same year to capture second place in the BERA ranking with a 1.22. Mike Torrez and Gene Tenace came in third with a BERA of 1.26.
The lowest BERA for a career belongs to Vida Blue and Dave Duncan who notched 1.74 in 362 innings compared to Blue’s career PERA of 3.45 with other catchers which he attained in 2,981 1/3 innings. The Blue-Duncan duo headed a list of three batteries out of the 1,093 qualifying teammates that all had a BERA of less than 2.00.
Who was the duet with over 1.000 innings together that had the best differential over the long haul? That honor goes to the team of Pedro Martinez and Jason Varitek who, in 1,133 innings, had an average differential of -1.80 when they posted a BERA of 2.34. Forty-seven other pairings had 1,000+ innings together and 46 of them had an average differential below their individual numbers. Only one tandem had a BERA higher than their career numbers but they were less than one run above.
The Worst Batteries
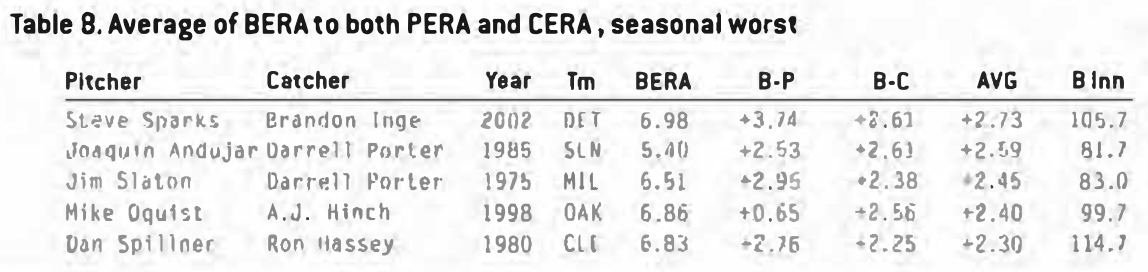
And now what about those guys who should never have been brought together? Who were the worst batteries, both in a season or in a career? First, we’ll start with the seasonal pairings that were almost dead batteries. Comparing the duo’s BERA to the pitcher’s season (PERA) the bottom of the barrel belongs to pitcher Steve Sparks and catcher Brandon Inge who, while playing for Detroit in 2002, posted a differential (PERA-minus-BERA) of +3.74 or almost four runs worse than Sparks’s seasonal ERA of 3.24. Coming in at a close second was the battery of Charlie Hough and Don Slaught with a BERA of 5.81 compared to Hough’s PERA of 2.57 which he notched for the Rangers in 1986.
The other seasonal perspective is CERA-minus-BERA or how well (or poorly) the tandem did in comparison to the catcher’s ERA is also held by the Sparks-Inge duo. While playing for the Tigers in 2002 the two showed no electricity at all when they had a differential of +2.61 or two and a half runs worse than the catcher’s season. Thirteen other batteries (out of the qualifying 2,039) had a differential of two runs or more above CERA.
When the two differentials are averaged, the worst seasonal battery again was Steve Sparks and Brandon Inge who should have been kept apart on the 2002 Tigers’ playing field. Their +2.73 average differential in 105 2/3 innings was the worst out of the qualifying pairings that had a minimum of 75 innings together. Table 8 shows the seasonal bottom five near-dead batteries.
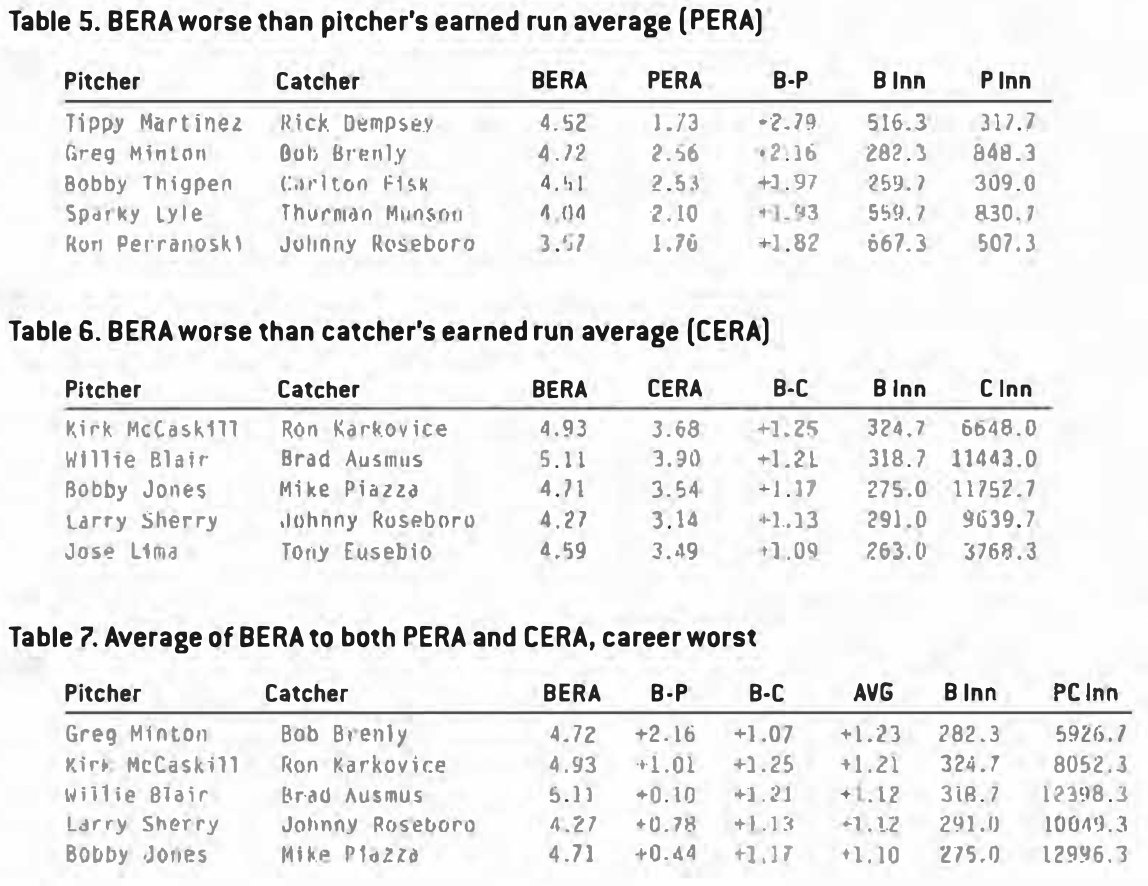
Looking at the career worst, the PERA-minus-BERA leaders were Tippy Martinez and Rick Dempsey who, in 516 1/3 innings, had a 2.79 worse ERA than Martinez’s career 1.73 without Dempsey. Coming in second place was the duo of Greg Minton and Bob Brenly whose differential was +2.16. In the CERA-minus-BERA analysis, the worst was pitcher Kirk McCaskill and backstop Ron Karkovice who posted a +1.25 differential above Karkovice’s career CERA of 3.68. Willie Blair and Brad Ausmus with a differential of +1.21 came in a very close second place. The very worst career battery, when both the PERA and CERA are considered is the team of Greg Minton and Bob Brenly. They posted a 1.23 higher BERA than either’s career numbers. Tables 5, 6, and 7 give the lowdown on the five bottom dwellers for all three perspectives.
The highest BERA for a season (minimum of 75 innings paired) was recorded by pitcher Brian Bohanon and catcher Henry Blanco who had a horrible 7.17 in 85 1/3 innings in 1999 with the Colorado Rockies. Bohanon’s PERA that year with all other backstops was 5.63 or one and a half runs better. Second place in the seasonal highest BERA is held by the duo of Jaime Navarro and catcher Dave Nilsson (MIL 1993) who posted 7.74. These two batteries headed a list of twenty batteries that all had a BERA greater than 6.00 and all twenty had BERAs above the pitcher’s ERA that year.
The highest BERA for a career (minimum of 250 innings together) belongs to pitcher Scott Erickson and catcher Charles Johnson who notched 5.32 in 264 innings together, compared to Erickson’s career PERA of 4.43 with other catchers. Coming in second was the team of Paul Abbott and Dan Wilson who posted a BERA of 5.30. They were just two of the four pairings with BERAs greater than 5.00 in 1,093 qualifying career batteries.
Hall of Famers
In the data period there were 19 seasonal pairings of Hall Of Famers and seven career match-ups. Only two seasonal pairings and four career pairings met the criteria. The best season was recorded by the battery of Carlton Fisk and Tom Seaver while with the Chicago White Sox in 1984 who had a BERA-minus-PERA÷CERA of -2.29 in 130 2/3 innings. The only other seasonal qualifier was the duo of Whitey Ford and Yogi Berra who in 1960 posted a differential of -1.17 for the New York Yankees. The best career differential belongs to Carlton Fisk and Dennis Eckersley with -0.88 in 468 innings when they had a BERA of 2.90. The worst career performance was by the Johnny Bench and Tom Seaver battery who posted a differential of -0.26 or just slightly better than their individual ERAs on average.
Summary
Using comparative earned run averages for all batteries provided an easy measure to gauge the very best and worst pairings in the data period (1960-2004 ). The duo of Kevin Brown and Charles Johnson were slightly superior to any other career match-ups. Together they never had a BERA higher than any other pairing for either player. That’s saying something given that Johnson had 187 different battery mates and Brown had 23. The same could not be said for the various worst batteries that separately had decent ERAs, but together they were a bad combination. Perhaps more attention should be paid to the dynamics of battery pairing. Certainly this study shows that sometimes a pitcher and a catcher have a certain spark as a team while other batteries should have been disconnected.
CHUCK ROSCIAM is a retired Navy Captain with 43 years active service. A SABR member since 1992, he also was an amateur catcher for over 40 years and the creator of www.baseballcatchers.com and tripleplays.sabr.org.
Author’s Note
Retrosheet Event Files are the source material for the years 1960-1992 and 2000-2004. David Smith provided the Event Files for 1993-1999.
Special thanks to SABR members Jim Charlton, David Smith, Tom Ruane, Clifford Blau, Keith Karcher and to West Point Mathematics Professor Mike Huber for their critique and suggestions. Also thanks to Craig Wright, Keith Woolner, and Tom Hanrahan whose research on the subject opened the door for further investigation.
Both the pitchers’ earned run averages (PERA) and the catchers’ earned run averages (CERA) do not include the specific battery’s earned run average (BERA) components.
This study does not purport that there is any statistical significance between individual catcher’s ERAs and other backstops on the same team, only that some measure of difference exists. Furthermore, like all small sample sizes, there is the possibility of random noise, but the specific criteria was used to wipe out as much noise as possible.