

Do Some Batters Reach on Errors More Than Others?
This article was written by Tom Ruane
This article was published in 2005 Baseball Research Journal
On one level, the answer to this question seems obvious: since batters strike out, fly out, and ground out at different rates, and since each of these three ways of making an out have very different associated error rates, batters who ground out in a high percentage of their at-bats should reach base on errors more often than batters who predominantly strike out and fly out.
But there still is a host of other potentially interesting issues I want to explore. Are there significant differences even among similar classes of hitters? Are there situational factors that need to be taken into consideration? For example, if there are much lower error rates with no one on, do leadoff batters reach base this way less frequently than cleanup hitters? How big a factor is batter speed? Or whether the batter bats from the right or the left side? Do some parks have much higher errors rates than others, due either to the influence of official scorers or environmental factors such as rocky infields, poor lighting, and unusual wind currents?
This article will attempt to explore these issues, although not necessarily in the order above. Before I begin, however, I must admit to some fuzzy terminology. When I talk about a batter reaching base on an error, I mean some things that are not classified as errors. This includes batters who strike out and reach first because of a wild pitch or passed ball. I include a batter who reaches due to a bad fielder’s choice that results in no outs being recorded on the play. In short, any play where no outs are made (except for the cases where the batter or runner gets greedy and is thrown out attempting to take an extra base) and the batter is charged with either a hitless at-bat, sacrifice hit, or sacrifice fly. Note that I am not including catcher’s interference in this group.
I examined play-by-play data of games from 1960 to 2004. I did not have play-by-play information for all these games, but I came pretty close.
The Simple Approach
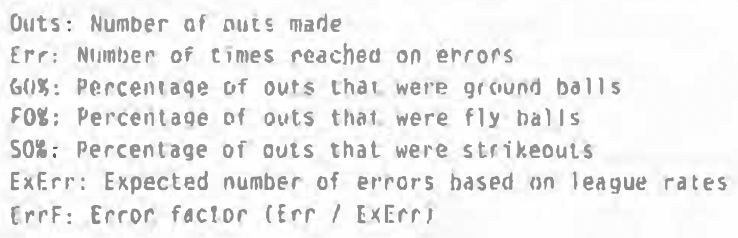
In the simplest terms, if you just look at the number of times a player’s outs turn into errors, do some players have much higher error rates than others?
To answer this, I computed how many outs a player was charged with, as well as how many of those resulted in an error. For each year I also generated an expected number of errors, by multiplying the number of outs by the league average of errors per out. I summed all of these, the player’s actual and expected errors, for his career and compared them.
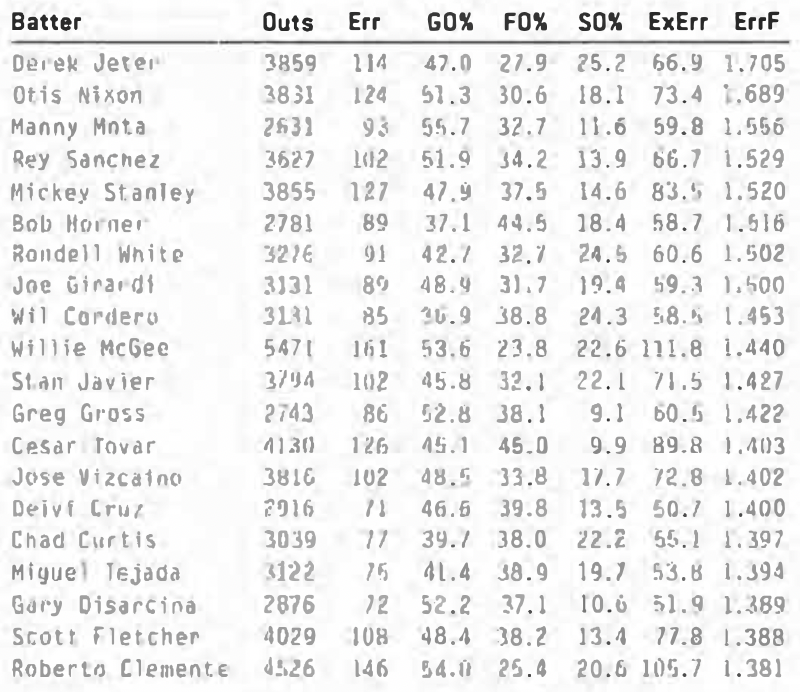
What did I find? Well, among players making at least 2,000 outs in their careers from 1960 to 2004, here are the ones who exceeded their expected errors by the greatest percentage:
And the lowest:
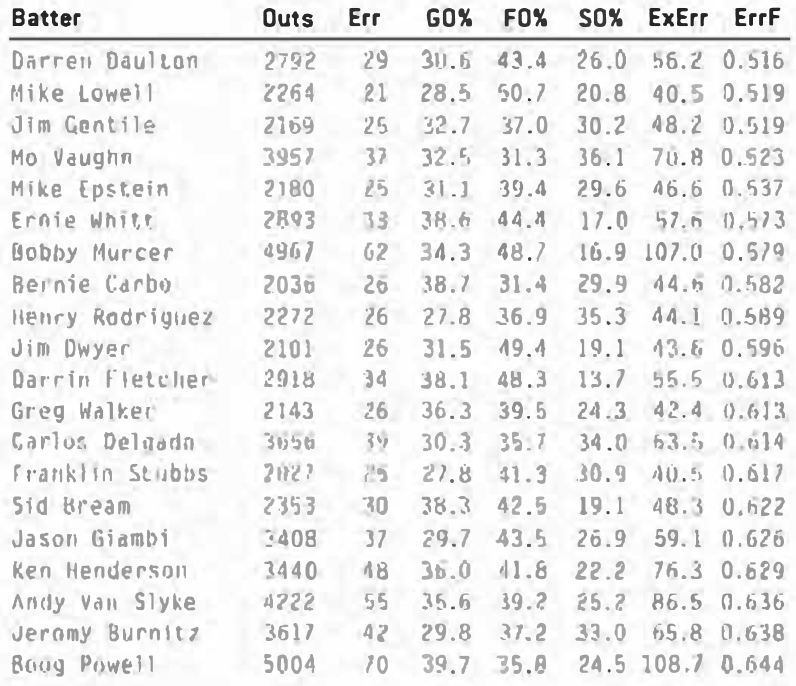
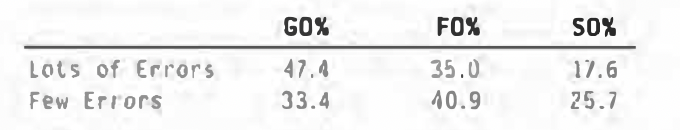
These are lists of very different types of players. For one thing, the players on the upper list hit a lot more ground balls than those on the lower. Here are the averages of the two groups:
Another thing that seems apparent is that the players on the bottom list tend to be a lot slower than the ones on the top. So it does look as if speed has something to do with the ability to coax errors out of a defense.
Still, there are anomalies. For example, Bob Horner would fit in much better with the players who seldom reach on errors. He’s a slow, fly-ball hitter. But instead of being surrounded by Jim Gentile and Mo Vaughn, he is in the company of Willie McGee and Cesar Tovar. So how much of this can be explained by simple randomness?
To find out, I simulated a random distribution of errors and compared these results to what actually happened. This approach is perhaps best shown by example.
The first season we have play-by-play data for Roy McMillan is 1960. He made 315 outs that season. In the National League that year, batters made 31,953 outs and reached on error 728 times, for a rate of .022785 per out. So to simulate a random season, I generated 315 random numbers (one for each out he made) between 0 and 1. If a number was less than .022785, I counted it as an error. I totaled all the simulated errors for that season and then did the same thing for all the seasons we have. When I was done, I had a randomly generated number of “errors” in Roy McMillan’s career (or at least that portion of his career for which we have play-by-play data).
I repeated this process 999 times, so that each player had 1,000 simulated careers.
Not surprisingly, the spread we see in the data is not random. The variance of the 835 players with 2,000 or more outs in our database was 201.55; the highest value in the 1,000 random simulations was 86.27. That is, the real-life data beat every one of the 1,000 random simulations, and by a considerable margin. It is therefore extremely unlikely that the players on the lists above got there by luck.
Now I mentioned earlier that this is not too surprising. After all, most errors are made on ground balls and it’s common knowledge that there are ground-ball and fly-ball hitters. In the rest of the article we will develop more sophisticated ways of determining the number of times a batter might be expected to reach base on errors.
Do Men on and the Number of Outs Affect Error Rates?
Yes.
Okay, perhaps I should expand on that answer.
What follows is a table with information on the three ways of making outs (groundouts, flyouts and strikeouts) in each of the 24 game situations (where outs go from 0 to 2 and the bases go from empty to full). Since we know that sacrifice bunts and failed fielder’s choice are affected by men on and the number of outs (for example, we can’t have either with the bases empty), they have been removed:
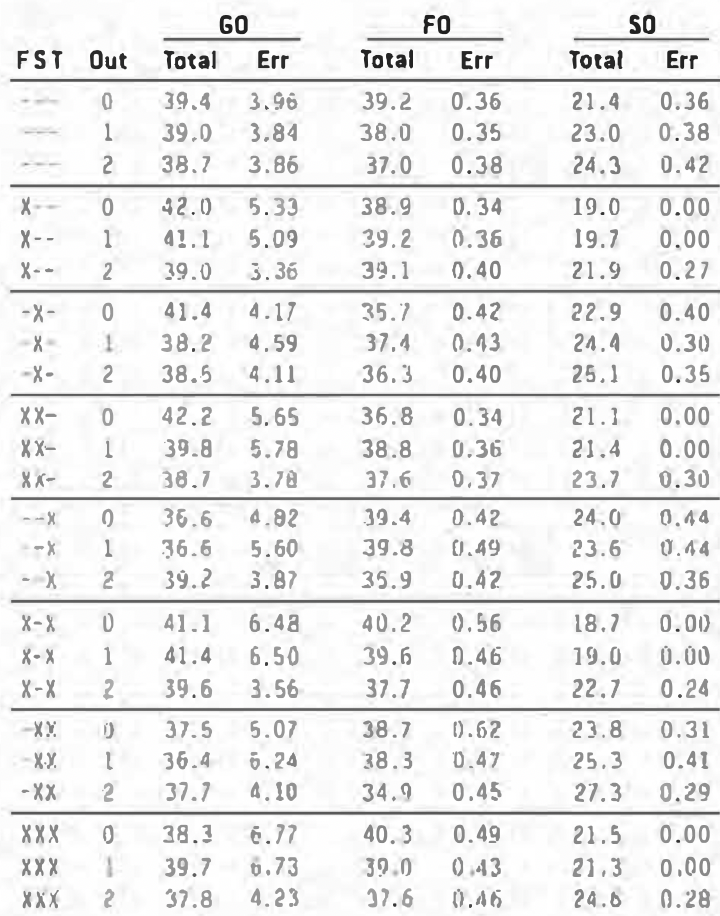
The number on the right (under “TOT”) shows how frequent the out is in that situation. So with no one on and no one out, the batter is out 39.4% of the time on a groundout, 39.2% of the time on a flyout, and 21.4% of the time on a strikeout.
The number on the right (under “ERR”) shows how frequent an error is for that type of play in that situation. So with bases loaded and no one out, a batter will be safe on an error 6.77% of the time on a groundout, 0.49% of the time on a flyout and never on a strikeout (since the catcher does not have to cleanly field a third strike with first base occupied and less than two out).
The first thing to notice is that the error rates are very different for different types of plays. Not surprisingly, groundouts result in errors around 10 times as often as flyouts, and batters reach base least often on a strikeout, but there are situations (no one on) when the flyout is the least likely play to result in an error.
The next point of interest is that the frequency of plays vary from situation to situation. Strikeouts are at their highest in all situations when there are two outs. Groundouts spike to more than half of all outs when there is either a man on first or a man on first and second with no outs.
Error rates also vary. For groundouts, the error rate goes from a low of 3.36% (man on first and two outs) to a high of 6.73% (bases loaded and one out). Fly-out error rates go from a low of .34% (no outs and a force at second) to a high of .62% (men on second and third and no outs).
Two things are clear from this analysis. First, we should take into account the type of outs a batter makes before declaring that he has a “talent” for reaching on errors. And second, it would be a good idea to consider the context of his outs as well, since expect ed error rates vary quite a bit from situation to situation.
Do We Need to Consider Park Effects?
I have always wondered whether or not certain parks were more “error-friendly” than others. In addition, I wondered whether parks favored some types of outs over others. To determine this, I looked at each team’s rates of errors, groundouts, flyouts, and strikeouts in the 24 game situations in both their home and road parks. Using their road rates, I computed an expected number of errors, groundouts, flyouts, and strikeouts in the home park. I next generated the four factors by dividing the actual home totals by the expected values.
There is certainty a fair amount of noise in the data, but something is going on here. As I did with the players, I also ran 1,000 random simulations. And as before, the spread in the data is not random. The variance of the 1,132 teams in our database was 211.55; the highest value of the 1,000 random simulations was only 91.28. Here are the teams with the highest error factors:
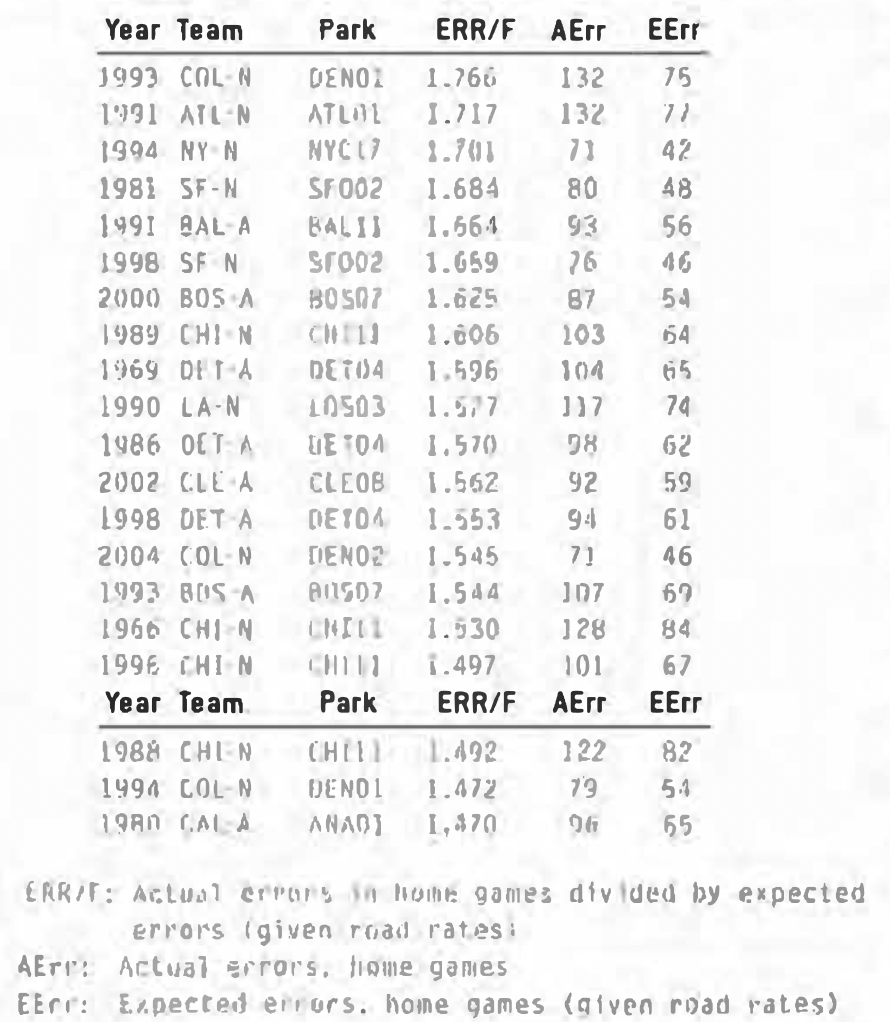
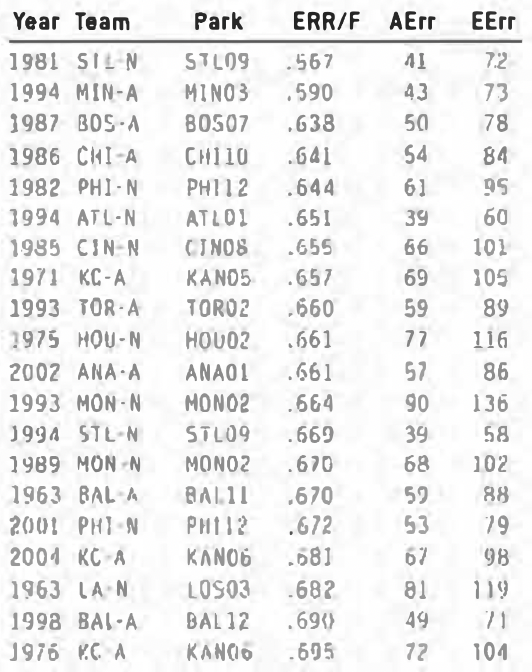
What factors in the games played in these parks that led to significantly higher than normal error rates? Environmental factors could be to blame, but the obvious cause would seem to be the official scorer. Clearly, many error/hit decision made by the scorers are not clear-cut and I’m sure we’ve all been to baseball games where we thought a decision of theirs was overly harsh or lenient.The teams with the lowest error factors:
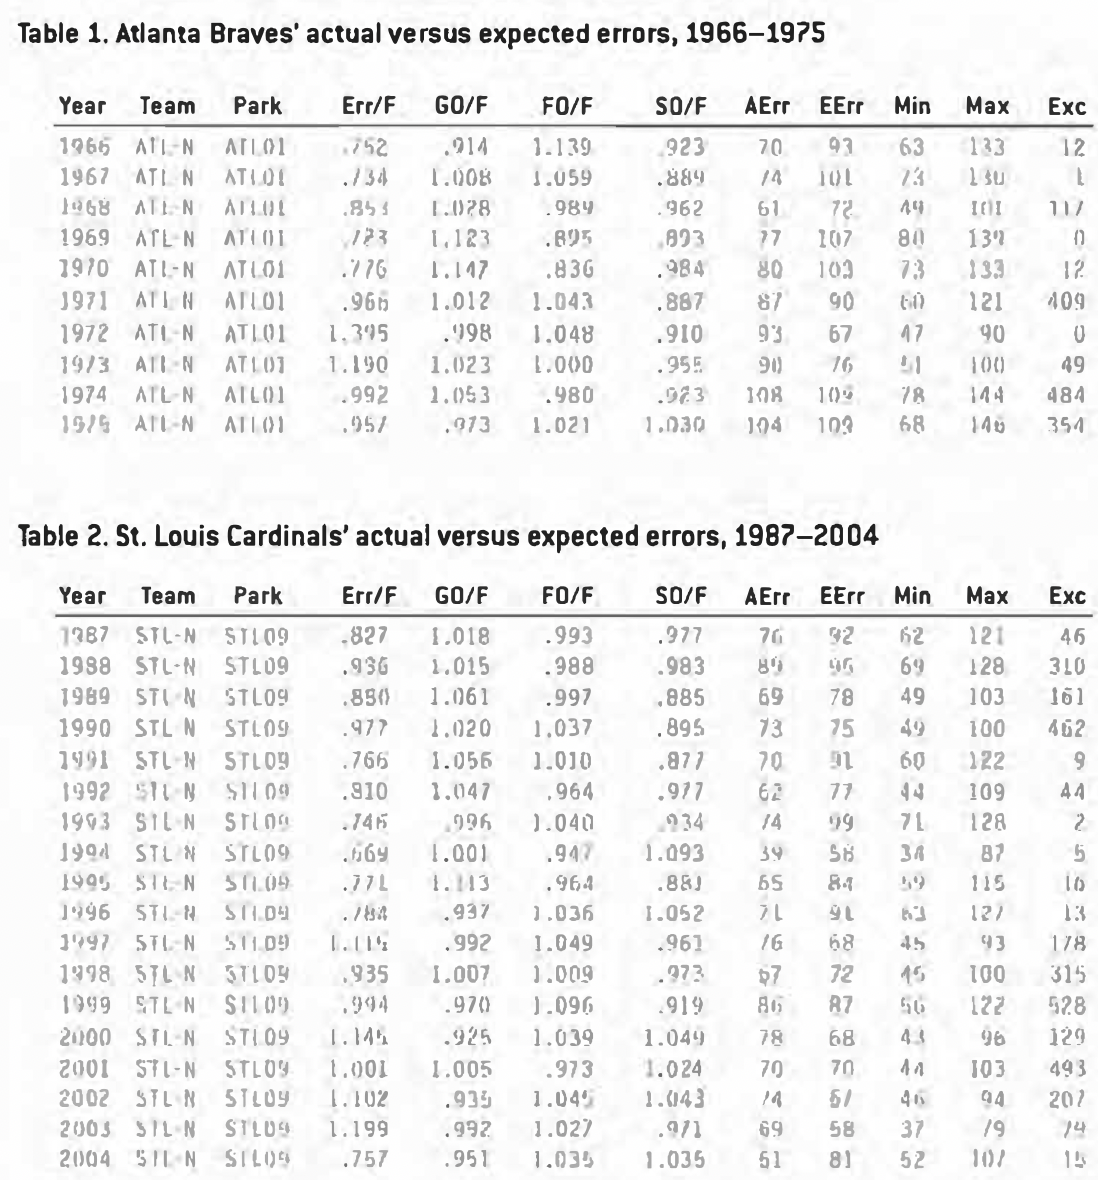
In reviewing the entire list of teams, I found a few interesting things. For example, look at the Atlanta Braves from 1966 to 1975 (Table 1). I don’t know, but I suspect something happened in 1971 to affect the error rates in Fulton County Stadium. From 1966 to 1970, fielders were more than 20% less likely to be charged with an error in Atlanta than they were when the same two teams played in another park. I would love to know who were the official scorers in Atlanta during that decade and if anything changed in 1971 to make their decisions less friendly to the fielders there.
Just about every team’s table raises similar questions. Table 2 shows data for the St. Louis Cardinals. What changed around 1997 to make errors more common in Busch Stadium? From 1966 to 1993, that park had lower than average strikeout rates in 17 of the 18 years – what happened around 1994 to make the park more neutral in that regard?
The answers will probably be: “I don’t know” or “Nothing,” but I do think it’s clear we need to take the park into account when determining expected error rates. I also think that, given the variation in much of this data, we need to average those rates over a three-year period.
For the subsequent analysis, I averaged the data for the prior and subsequent seasons if the team played the majority of its home games in the same park. and I weighted the current year twice as heavily as the surrounding ones.
Adjustments
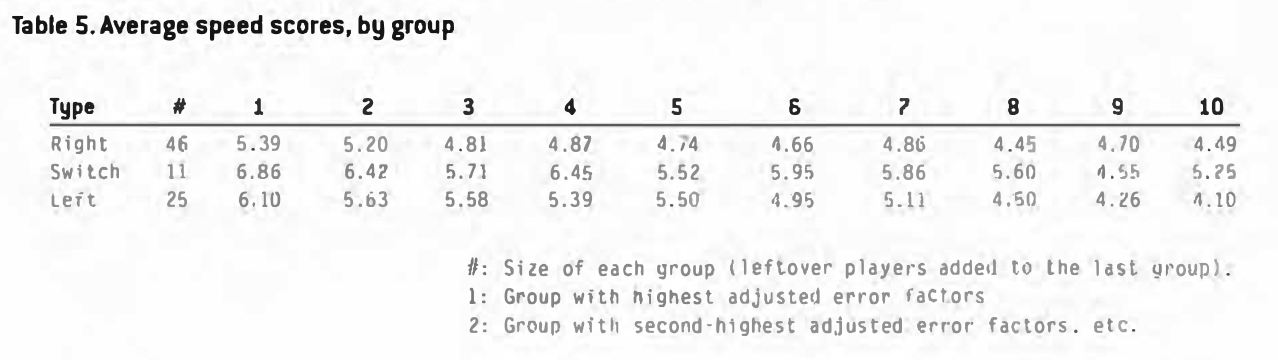
So it looks like we need to adjust the simple approach used at the beginning of the article to take into account the type of outs, situations, and parks a batter hits in. I also wanted to make one more adjustment. Since the handedness of the batter makes a big difference, I wanted to adjust for this in order to see if some players hit balls that were harder to field cleanly, independent of their handedness. So I computed error factors for each league by handedness, and adjusted the players for these factors. After all these adjustments, the players with the highest error factors were quite a bit different than before (see Table 3 and Table 4).
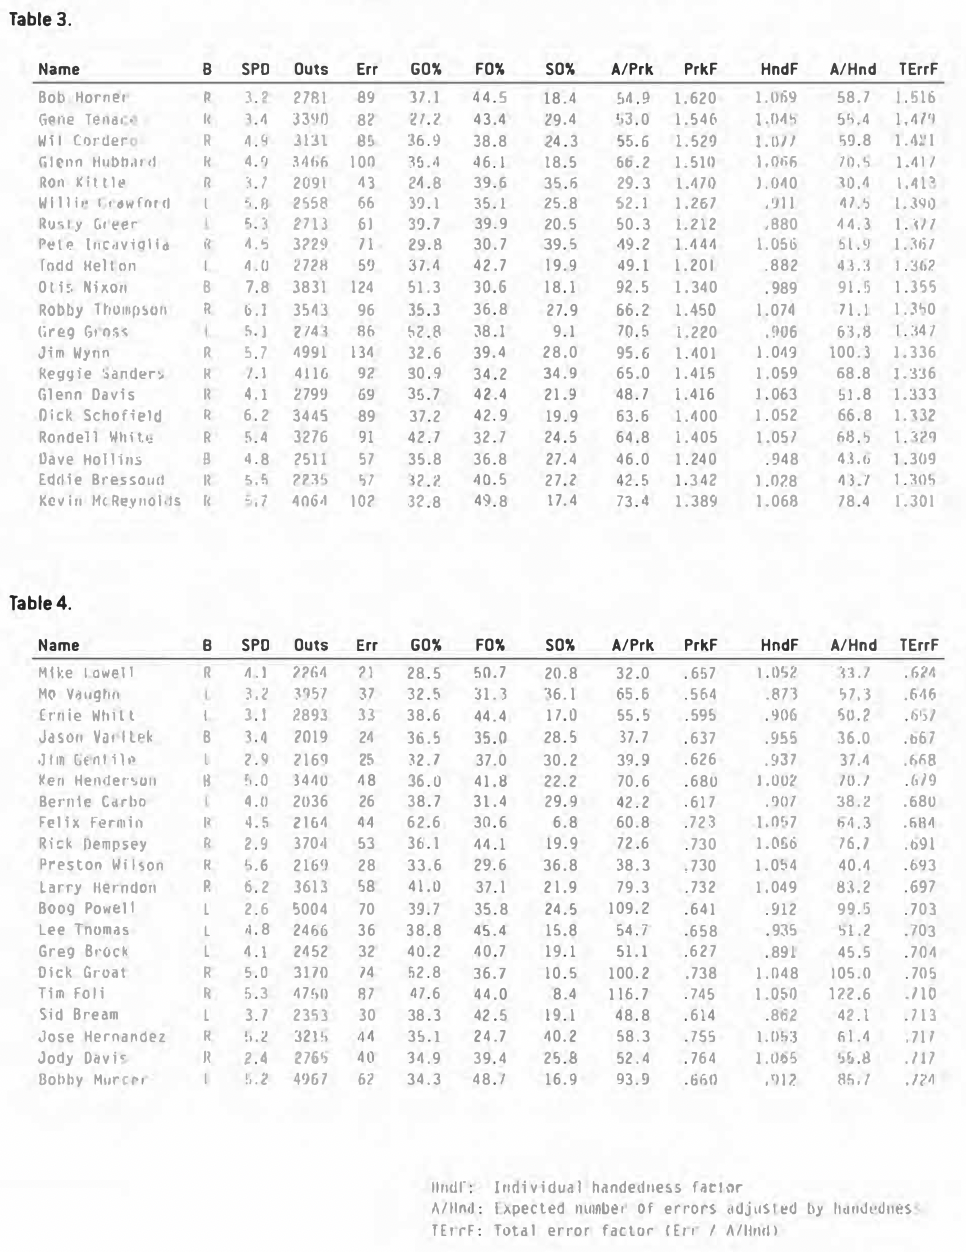
Considering that Bob Horner was the only fly-ball hitter on the earlier list, it is not too surprising that he jumps to the top of the class once we take the types of outs into consideration. One interesting thing about Horner is that his final adjusted-error factor ended up being the same as the one we started out with. He got a big boost (1.516 to 1.687) for belng a fly-ball hitter, then saw his rate drop (1.687 to 1.620) because he played in generally error friendly parks, and then was dropped back to his original rate (1.620 to 1.516) because he’s a right-handed hitter.
The column ”SPD” is the batter speed, derived using Bill James’ speed scores (higher is faster). Notice that speed is also a big factor. I took the righties, lefties, and switch-hitters and broke each of these groups into 10 sections, sorted by their adjusted error factors. Table 5 shows the average speed scores for the players in each group.
Once again, the spread we see in the data is not random, although the spread is far less now that we’ve accounted for many of the things causing it. The variance of the 835 players with 2,000 or more outs in our database is now 119.25; the highest value in the 1.000 random simulations was 83.91. It is unlikely (although not as unlikely as before) that the players on those lists above got there by luck.
It does seem, however, that if we are making all of these adjustments to attempt to see if players had different abilities to hit into difficult chances, we might want to remove strikeouts from the picture. We’ve already looked at strikeout rates and seen how they affect a player’s ability to reach on an error, but let’s see what happens when we ignore them.
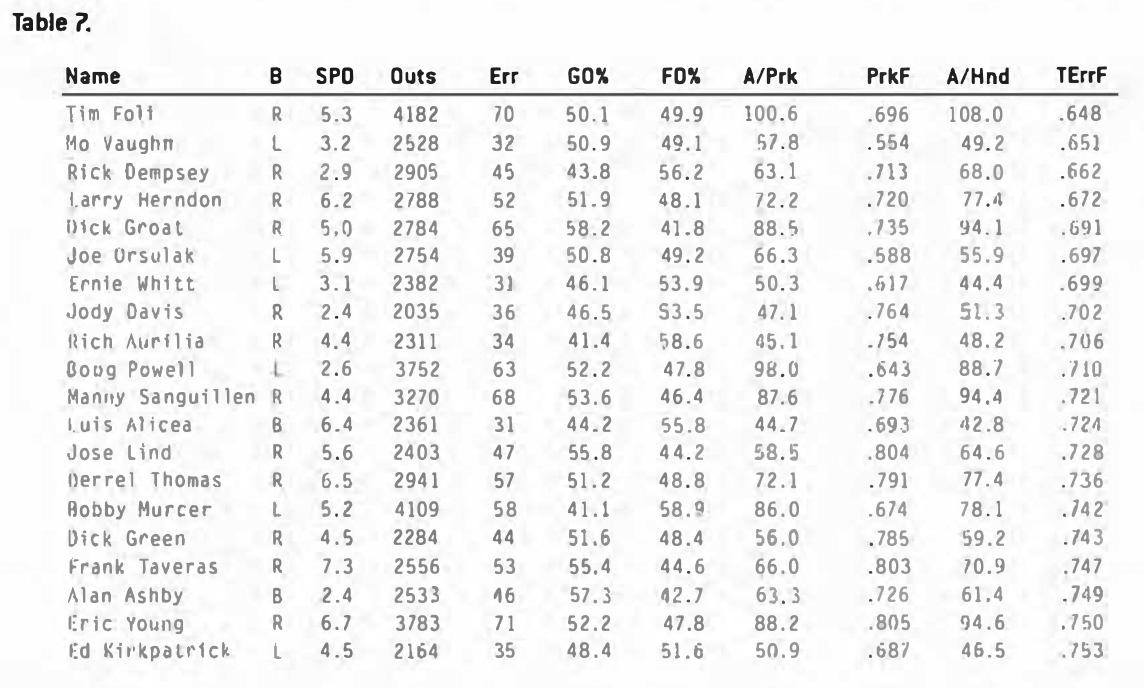
So this time we are ignoring strikeouts, sacrifice attempts, and not treating unsuccessful fielder’s choice as errors (since they were handled cleanly). The changes to the leader board are displayed in Table 6; not a tremendous difference, but I do think this focuses more clearly on what we are trying to look at. Some players dropped off the list because removing strikeouts brought them below the 2,000-out minimum for inclusion.
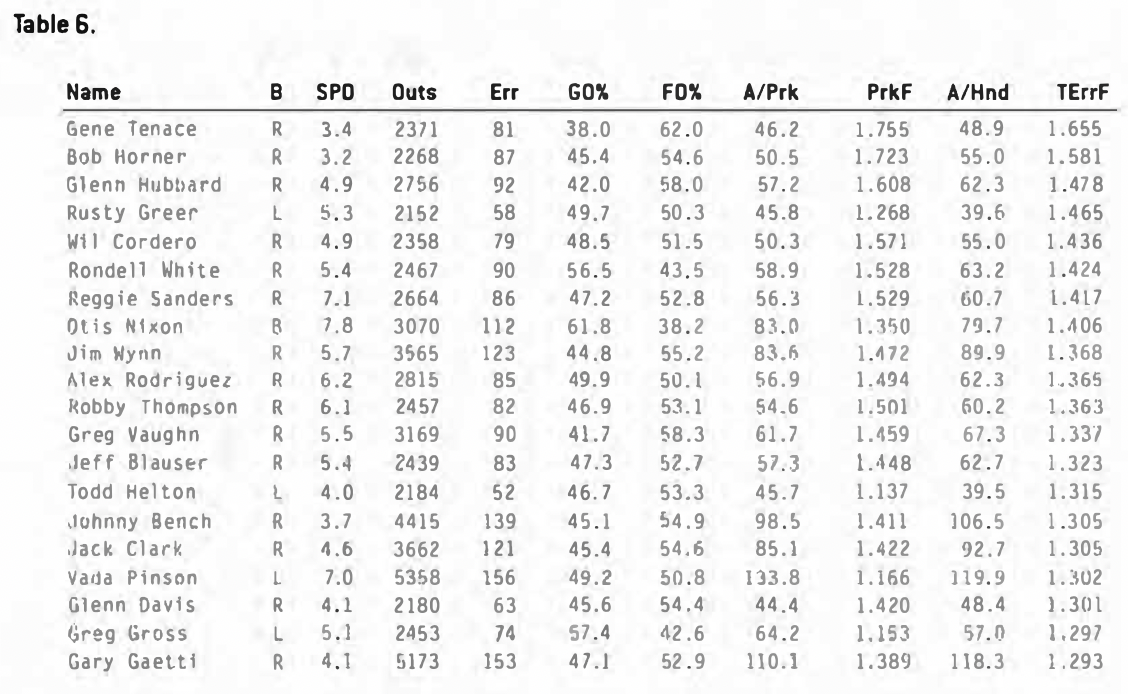
Table 7 shows the players with the lowest error rates with these plays removed. Tim Foli, with a very low strikeout rate, moves to the top of this list, and Felix Fermin would have been in third place if he had still met the 2,000 out requirement.
We shouldn’t let all of these adjustments obscure the fact that right-handed ground-ball hitters generally reach base on errors a lot more than lefty fly-ball hitters. Despite the final results above, Derek Jeter still reaches base a lot more often than any player on these adjusted lists, and one could argue that the most significant list of players we presented in this article is the first, totally unadjusted, one.
Still, I wanted to go through these contortions to see if I could identify two groups of players: one whose batted balls tended to be difficult to handle and one whose outs posed much less of a challenge. Much like the differences in ballpark error rates presented above, I don’t know if Gene Tenace, Bob Horner, and Glenn Hubbard really hit scorching ground balls or whether Mo Vaughn didn’t. Perhaps people who have watched the players on these two lists play more than I have can comment on this. I do know that these differences are unlikely to occur by chance. Even after taking into consideration a host of things that might account for these differences (with the notable exception of batter speed), there still seems to be some significant differences in how difficult each batter is to retire on his outs.
What About Pitchers?
I realize that the title of this article mentions only batters, but I figured it would be an oversight to conclude this piece without a discussion of which pitchers gave up more than their share of errors. This is probably more interesting to current researchers than what I’ve been talking about so far, in light of recent work (most notably by Voros McCracken and Tom Tippett) on the subject of how much influence pitchers have over the successful disposition of balls in play.
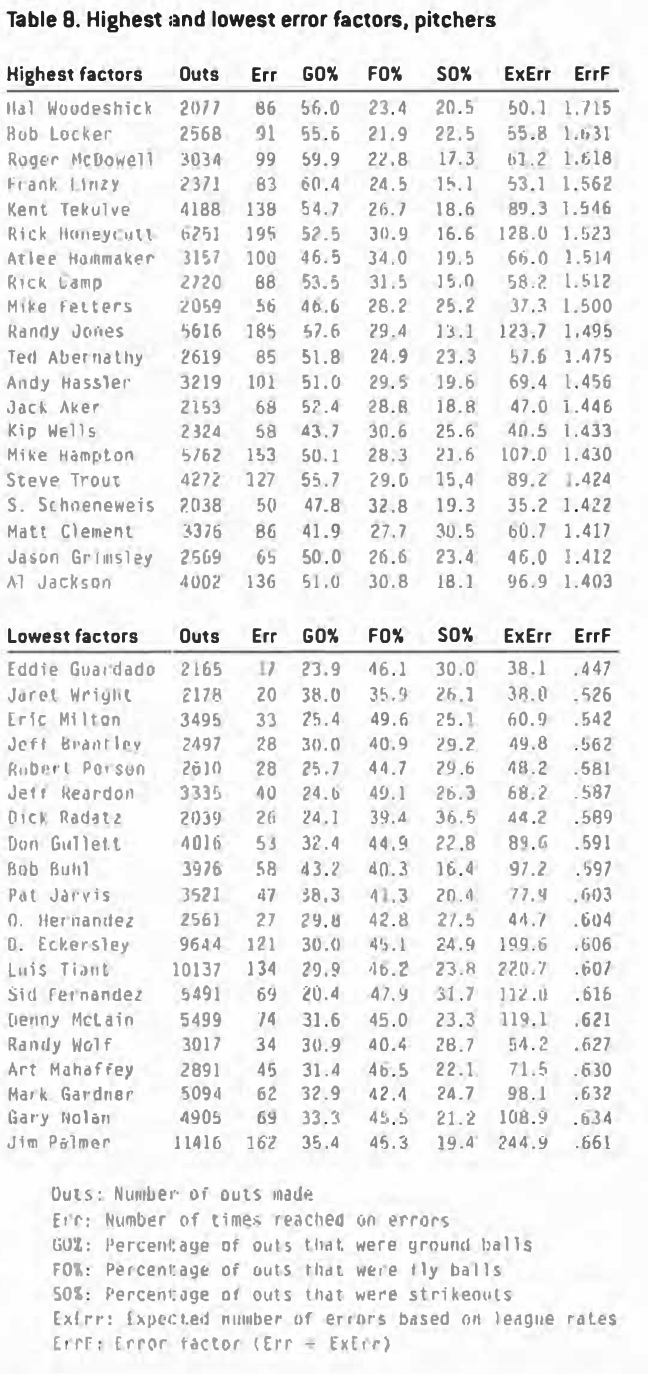
Before getting too far into this, it should be obvious that one big thing pitchers can do to minimize errors is to strike out as many hitters as they can. Error rates on strikeouts are extremely low, as are errors on fly balls. So we should see a wide disparity between error rates behind different types of pitchers and, at least before any adjustments are made, we do.
Pitchers with the highest error factors are listed in Table 8. As you might expect, the top list is dominated by ground-ball pitchers, and the bottom list is filled with those who primarily get their outs in the air or by strikeouts. Adjusting for type, situation, park, and handedness mixes things up a bit (see Table 9).
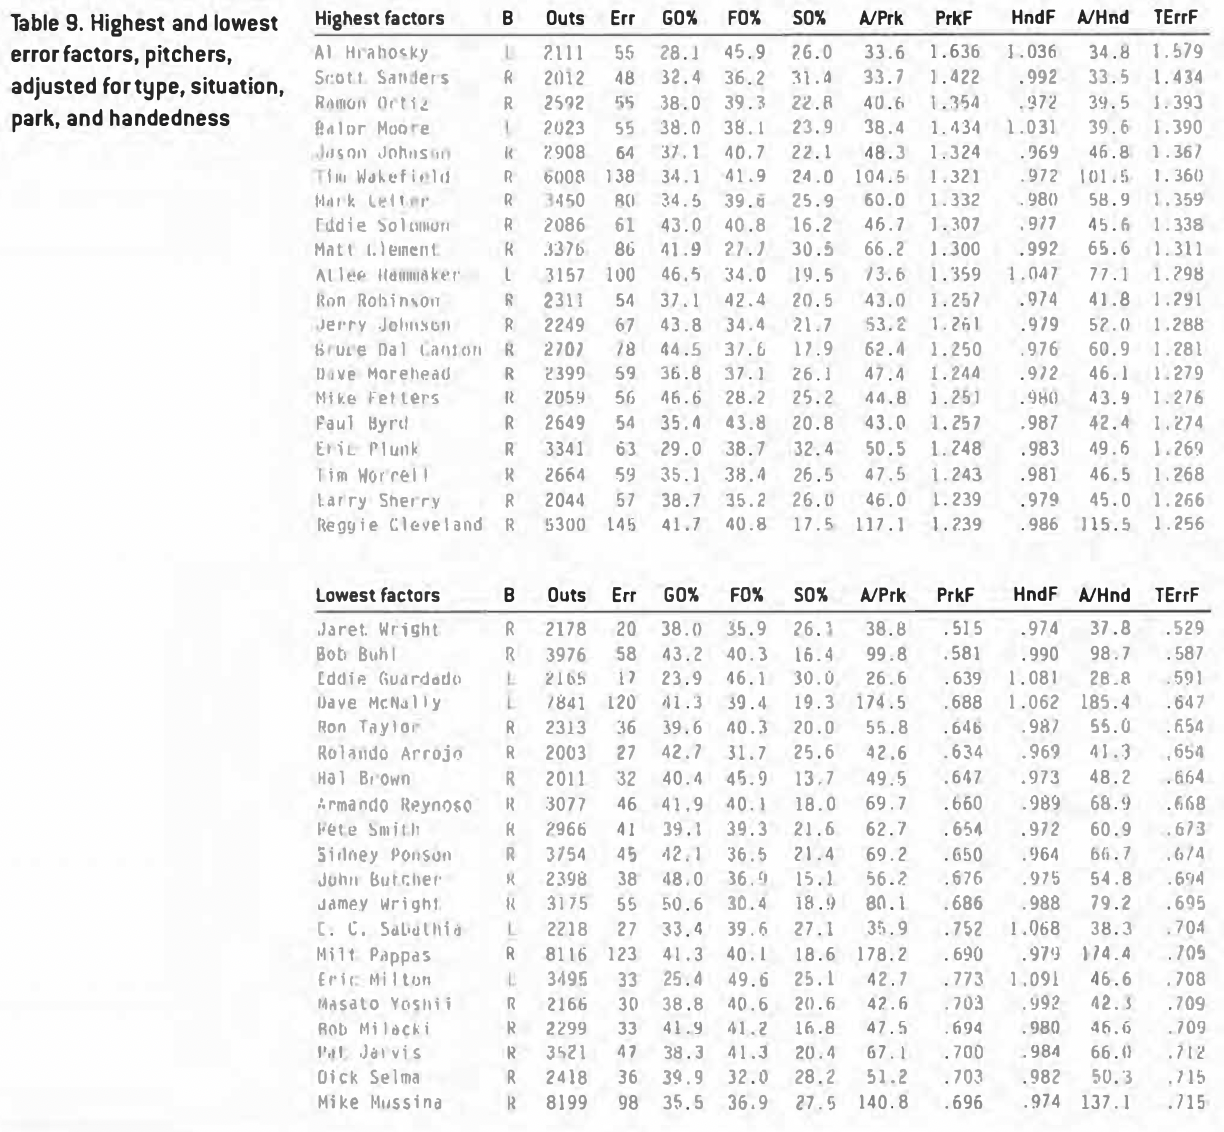
Two things concern me about this methodology when used with pitchers instead of hitters. First, while a batter puts balls in play against a variety of defenses during the course of a season, a pitcher is stuck (or blessed) with much the same defense in every game. The other important thing to remember is that the pitcher himself is also part of his defense and could be a significant factor in both errors on sacrifice attempts as well as the incidence of strikeout victims reaching base.
So it’s unclear whether Dave McNally’s ability to minimize errors is really a skill we should attribute to him or to Mark Belanger, the shortstop for many of his starts. Pitchers move from team to team, and team defenses also change, sometimes dramatically, over time, but these concerns are still there and, at least to me, muddy the water in a way they didn’t for the batters.
Conclusion
It shouldn’t be a surprise to anyone that this article raises many questions and comes up with relatively few answers. It does provide some data to back up what most of us already knew: grounders produce more errors than flyouts, righties reach on errors more often than lefties, the speed of a batter affects error rates, and so on. But I feel that the questions it raises are far more interesting than these “answers,” and I hope that this article stimulates interest in this somewhat obscure topic and encourages people to investigate some of these open questions.
What caused error rates to suddenly drop or rise in certain parks? What caused the fluctuations in some parks’ ground-out, fly-out or strikeout factors? Why were Bob Horner’s outs so much harder to field cleanly than Mo Vaughn’s? Hopefully, this article is a first small step toward answering some of these kinds of questions.