

Does the Home Team Batting Last Affect Game Outcomes? Evidence from Relocated Games
This article was written by Woody Eckard
This article was published in Fall 2024 Baseball Research Journal
Major-league rules have stipulated since 1950 that the home team always bats last. However, as Gary Belleville relates in a recent Baseball Research Journal article, an exception has been added to the rulebook:
Starting in 2007, any team that had to relocate a home game to another city would still bat last. … MLB’s revised policy … resulted in the home team batting first in 44 contests between 2007 and 2022.1
These relocations were caused by events outside of baseball, completely unrelated to the win-loss records of the involved teams. In other words, they were random with respect to the key variable in the present study: club winning averages. As such, these relocations constitute natural experiments that provide an opportunity to estimate the impact on game outcomes of the home team batting first (HTBF) rather than last.
The interesting question, of course, is whether it makes a difference. Do teams win at a lower rate when, instead of batting last at home, they bat first? The common presumption and the basis for the rule change is that batting last provides an advantage that leads to more wins. This article analyzes that question using the above-described natural experiments inadvertently created by the rule change. We find no evidence of a bats-last advantage. To my knowledge, this is the first analysis of this issue for major-league baseball.
The paper proceeds as follows. The first section provides some historical background, including related studies on college baseball. Next is a presentation of our data associated with the 44 HTBF games since 2007 and a discussion of the possible influence of the 28 games from the empty-stadium 2020 COVID-19 season. The third section describes the statistical methodology used to estimate the impact of HTBF. The fourth section presents those estimates in terms of the actual HTBF victories versus a hypothetical expected victory total assuming instead that our sample teams had batted last. The last section summarizes and concludes.
BACKGROUND
Starting in the mid-1880s, major-league home teams were given the choice of batting first or last.2 During the next several years, they often elected to bat first. But by the mid-1890s, HTBF had declined and, as Belleville put it, “by 1901 teams rarely batted first at home.”3 Finally, after 1914, no home teams batted first through 1949, after which a new rule eliminated the option. In 2007, MLB created the above-noted exception requiring relocated home teams to bat last. In that year, for the first time in over nine decades, teams playing at home batted first rather than last.
As David Nemec notes: “by the early part of the [twentieth] century having your last at bats was viewed as an advantage,” and it is still so viewed today.4 In fact, the relocation exception was apparently created because batting last on the road was presumed to at least partially offset the disadvantage of losing the well-established home-field advantage. But it’s not clear why batting last would create an advantage. There is little discussion of the issue today, perhaps because it has been a given for over a century. As Theodore Turocy observes, “Received wisdom … holds that it is a clear and obvious advantage to … have … ‘last ups’ [and so] no justification is necessary.”5 Be that as it may, before analyzing why the presumed advantage exists, there should first be evidence of its existence. However, there has been little empirical analysis of the issue, likely because of the almost total absence of data.6 Prior to 2007, there had been no home-team-bats-first major-league games for almost a century. For example, in the above referenced article published in 2008, Turocy notes:
… because random assignment of teams to the first and last batting roles has [occurred] not at all in 130 years, natural experiments for separating home field advantage from the effects of the order in which teams bat do not exist [for major-league baseball].7
As noted above, this circumstance has now changed.
While the absence of data has prevented MLB-focused studies, college baseball has presented some opportunities. In particular, in NCAA national championship tournaments, the batting-last rule often is set aside and batting order is determined by other means, such as a coin flip. This in turn has produced many home-team-batting-first situations, allowing empirical analysis.
There have been two main studies using NCAA tournament data, both finding no support for a bats-last advantage. First, in 2006, Simon and Simonoff examined tournament baseball games to estimate the impact of the batting-last rule on game outcomes. They concluded that “there is little evidence of a ‘last licks’ effect.”8 Second, in 2007, Bray, Obara, and Kwan similarly examined a different sample of NCAA tournament baseball games for the same purpose. Their results did not support the hypothesis that home teams “would win a greater percentage of the games in which they batted last compared with when they batted first.”9
It should be noted at the outset that in a closed “league” like major-league baseball, across all clubs the aggregate league won-lost record cannot vary from .500, as each game produces both a win and a loss. Thus, for the league as a whole, to the extent that home team batting last impacts home wins, it has an equal but opposite impact on road wins. The issue, therefore, is simply the distribution of all wins between home and road.
(Click image to enlarge)
DATA
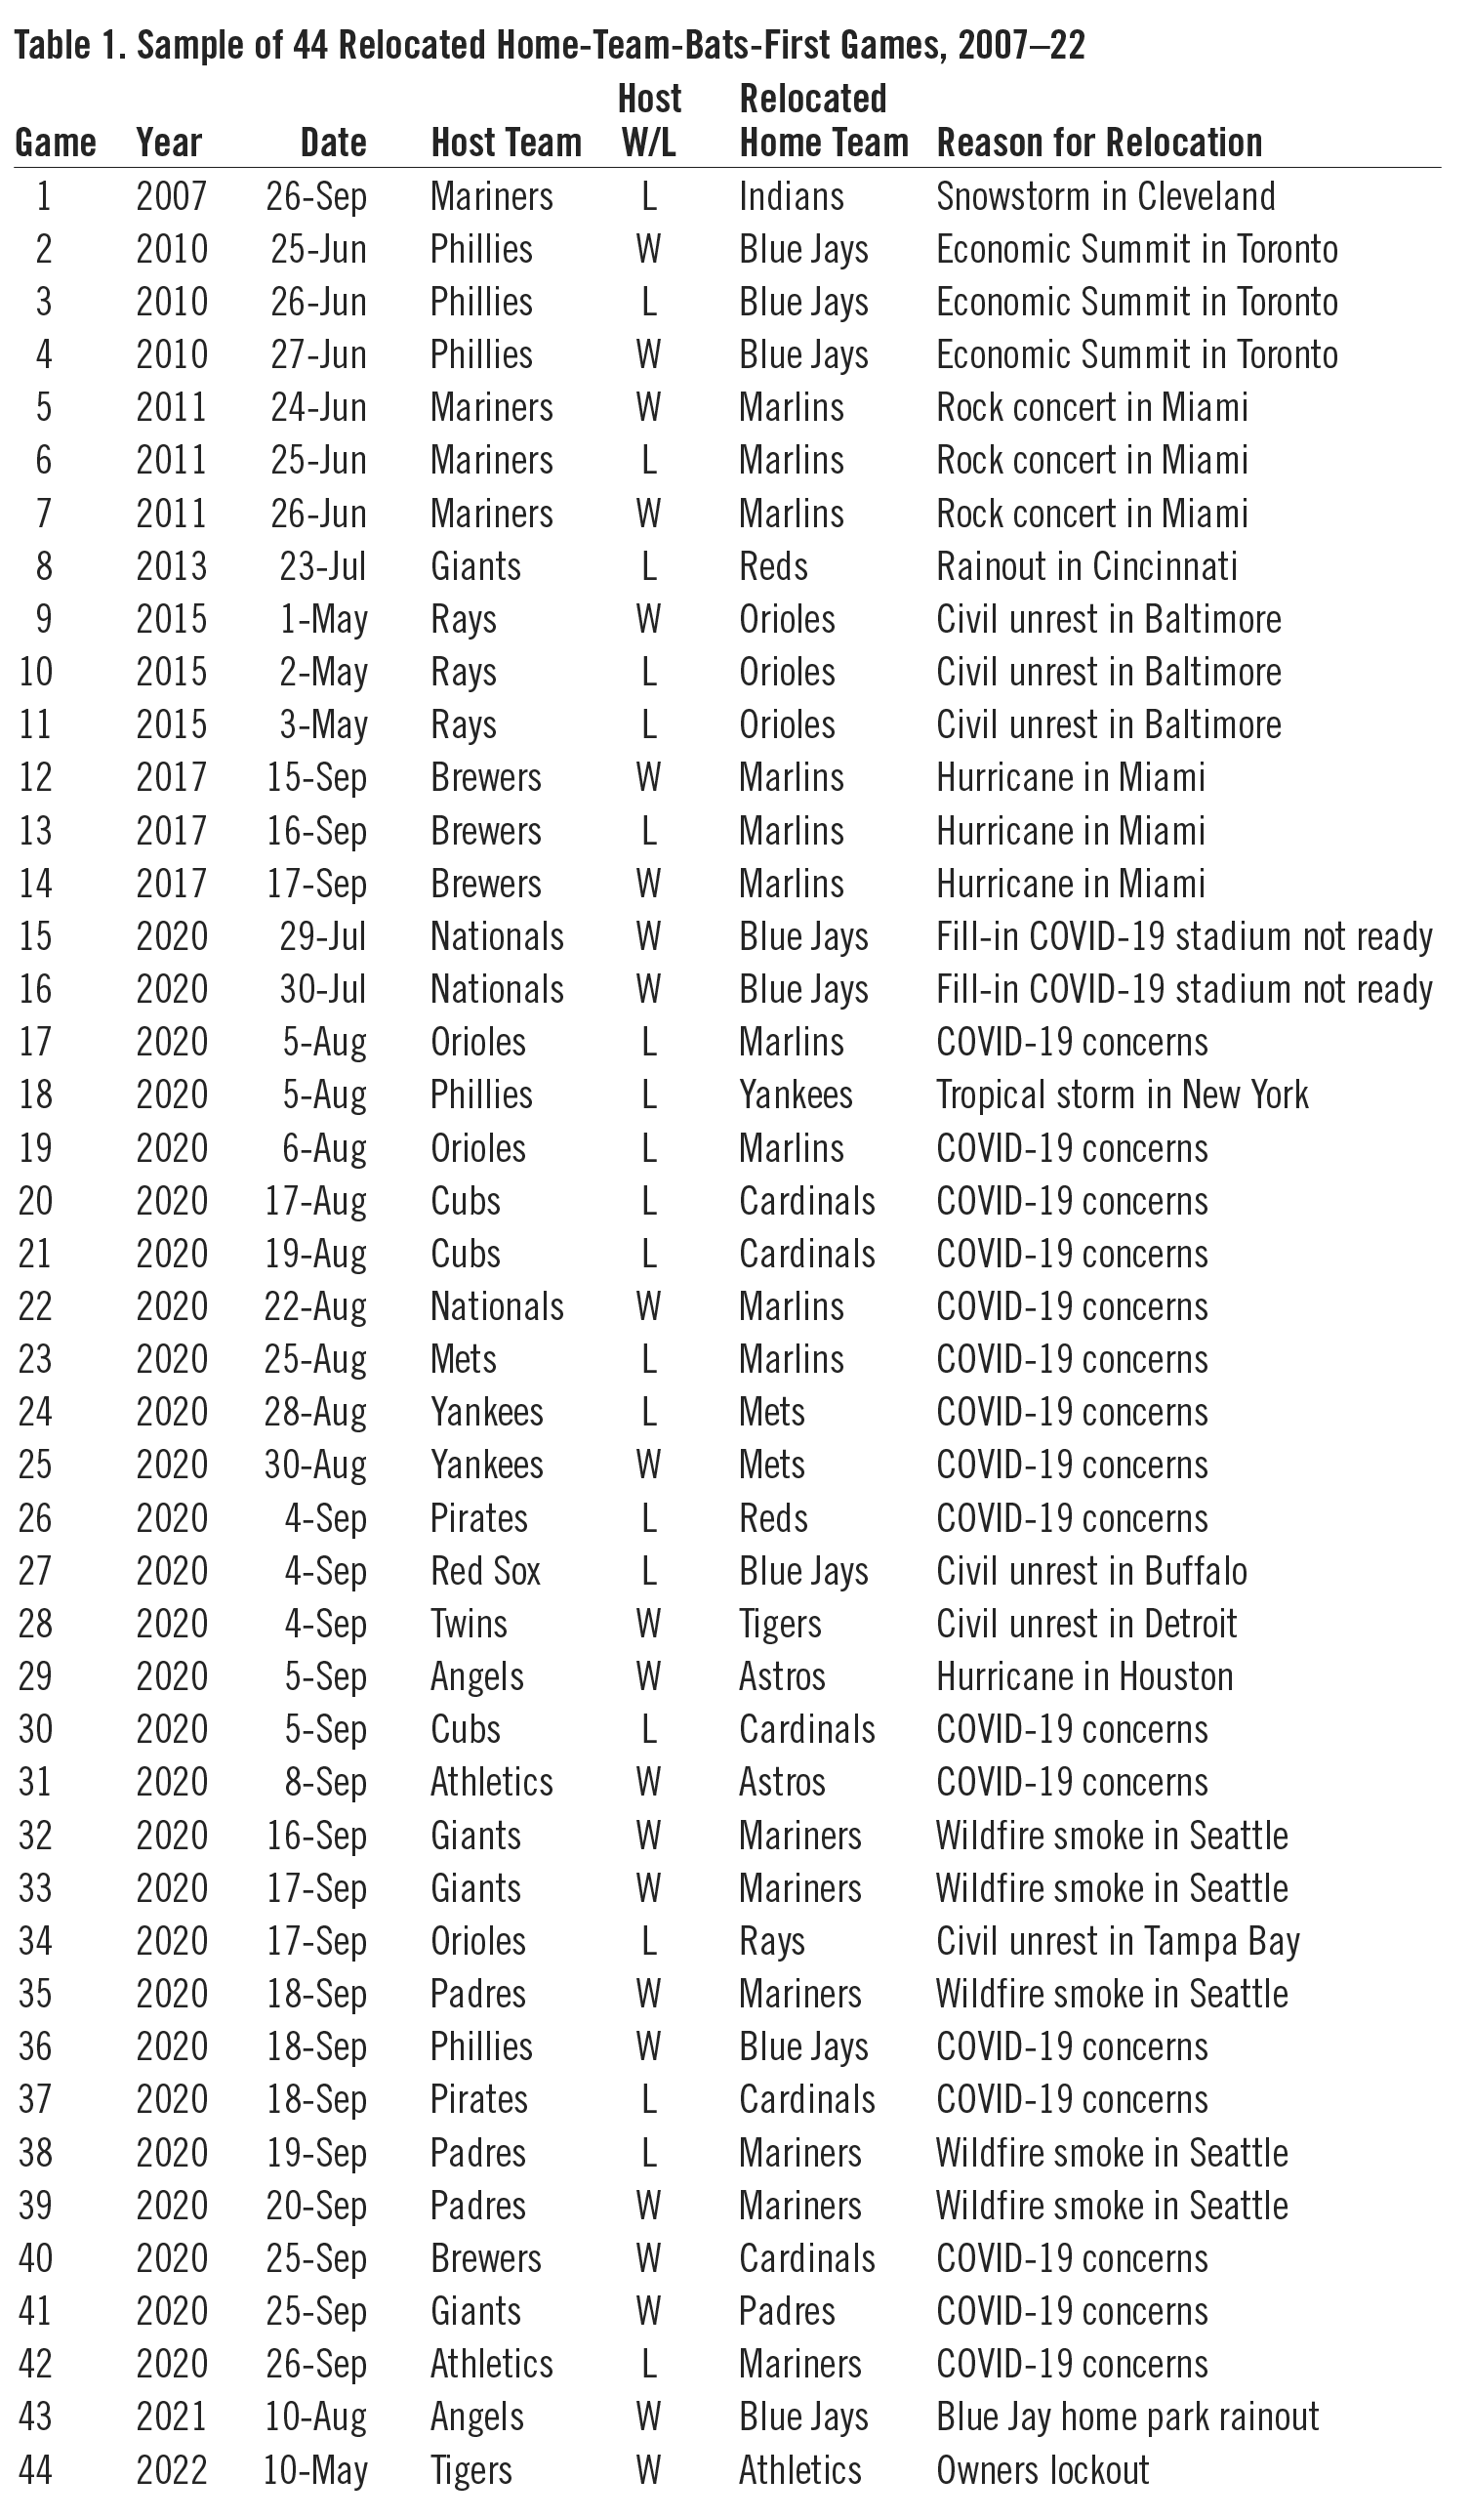
Table 1 displays our sample of 44 relocated games, sorted by year, date, and host team, meaning the team whose stadium the game was played in, as opposed to the “home team,” defined in the rules as the team that bats last.10 The principal source was the above-mentioned Belleville BRJ article, supplemented by game logs available from Baseball Reference. We number the games from one to 44 to clearly identify each. The “host teams” in the table constitute our sample because, by playing a game in their own stadium, they ordinarily would have batted last but instead, in effect, were assigned visiting team status. The “relocated home team” is the opponent that was assigned home-team status and batted last. “Host W/L” indicates whether the team playing at home and batting first won or lost the game.
Twenty-eight of our 44 sample games occurred during the COVID-19-shortened 2020 season, 14 occurred prior to 2020, and there was one each in 2021 and 2022. The sample contains 17 different host teams. The Philadelphia Phillies account for five games and the Milwaukee Brewers, San Francisco Giants, and Seattle Mariners each appear four times. Thus, the sample is not dominated by a few teams. On five occasions an entire three-game series was relocated.
The last column of Table 1 gives reasons for the relocations. The most common was concerns over COVID-19 outbreaks in 2020, accounting for 16 relocations from eight cities. Unusual weather, including three hurricanes or tropical storms, caused eight relocations from six cities. Civil unrest forced six relocations from four cities, three in 2020. Smoke from wildfires near Seattle caused five Mariners games to be moved to either San Francisco or San Diego, all in September 2020.
The 28 games in 2020, 70 percent of the sample, raise concerns about the unique circumstance of that season biasing the results. For example, because of the pandemic, all major-league games in 2020 were played in empty stadiums. This eliminated any fan effects often presumed to be important in explaining the home-field advantage. Our host teams had a 14–14 record in 2020, and were 9–7 in the other years. Thus, the winning averages were very similar for the two groups, .500 and .562, respectively.
Also, several formal studies have found that the crowdless 2020 season did not affect home vs. road performance. For example, Daniel and Fullmer examined 8,188 major-league games, comparing the 2020 season to the previous three seasons, and found “no significant effect of crowds on home team performance.”11 Similarly, Chiu and Chang investigated 13,044 regular-season games, comparing 2020 to the previous five seasons. They found that “home advantage in the 2020 season [without fans] was not significantly different from that in 2015–2019 in MLB. … Spectators may not be a crucial factor in home advantage.”12 Zimmer, Snyder, and Bukenya also compare the pandemic season to the previous five seasons with the same conclusion: “the lack of fans did not influence game results.”13
METHODOLOGY
In our 44-game sample, the host team, batting first, won 23 games and lost 21. But what should we compare this to? The ideal is the counterfactual outcomes if the host team had batted last. This, of course, cannot be observed. But we can estimate these hypothetical outcomes using each team’s home-road splits based on games involving the home team batting last. The associated home winning averages provide estimates of the probability of home team victory. This in turn can be used to estimate the expected number of counterfactual bats-last victories in our sample games.
For example, assume a given team in a given year has a home winning average of .550. In 20 home games against average teams we would expect 20×.550=11 wins. For a single game, the expectation is 1×.550=.550 wins. In effect, the home winning average is the single game win expectation or probability. We can add this 20 times to get the 20-game expectation of 11. If instead we had 20 games involving clubs of varying quality, some good and some bad, to get the expected number of wins we would add the appropriate win expectation for each of the 20 games. Algebraically:
(1) EXPW = SUM (EXPWG),
where EXPW is the expected number of wins summed over G games with the appropriate win expectation EXPWG for each game. If visiting team quality varies, win expectations will also vary. In other words, they would depart from the full-season value that is an average against all visitors and would apply directly only to the typical or average home opponent.
We can estimate the host team win expectation for each game using a formula developed by Bill James.14
In particular:
(2) EXPWG = (HA – HA*RAG)/(HA + RAG – 2*HA*RAG),
where HA is the host team season winning average and RAG is the relevant relocated home team season winning average. The expected number of host team wins can be calculated, per equation (1), by summing the win expectations for all games involving a relocated home team.
(Click image to enlarge)
ESTIMATION
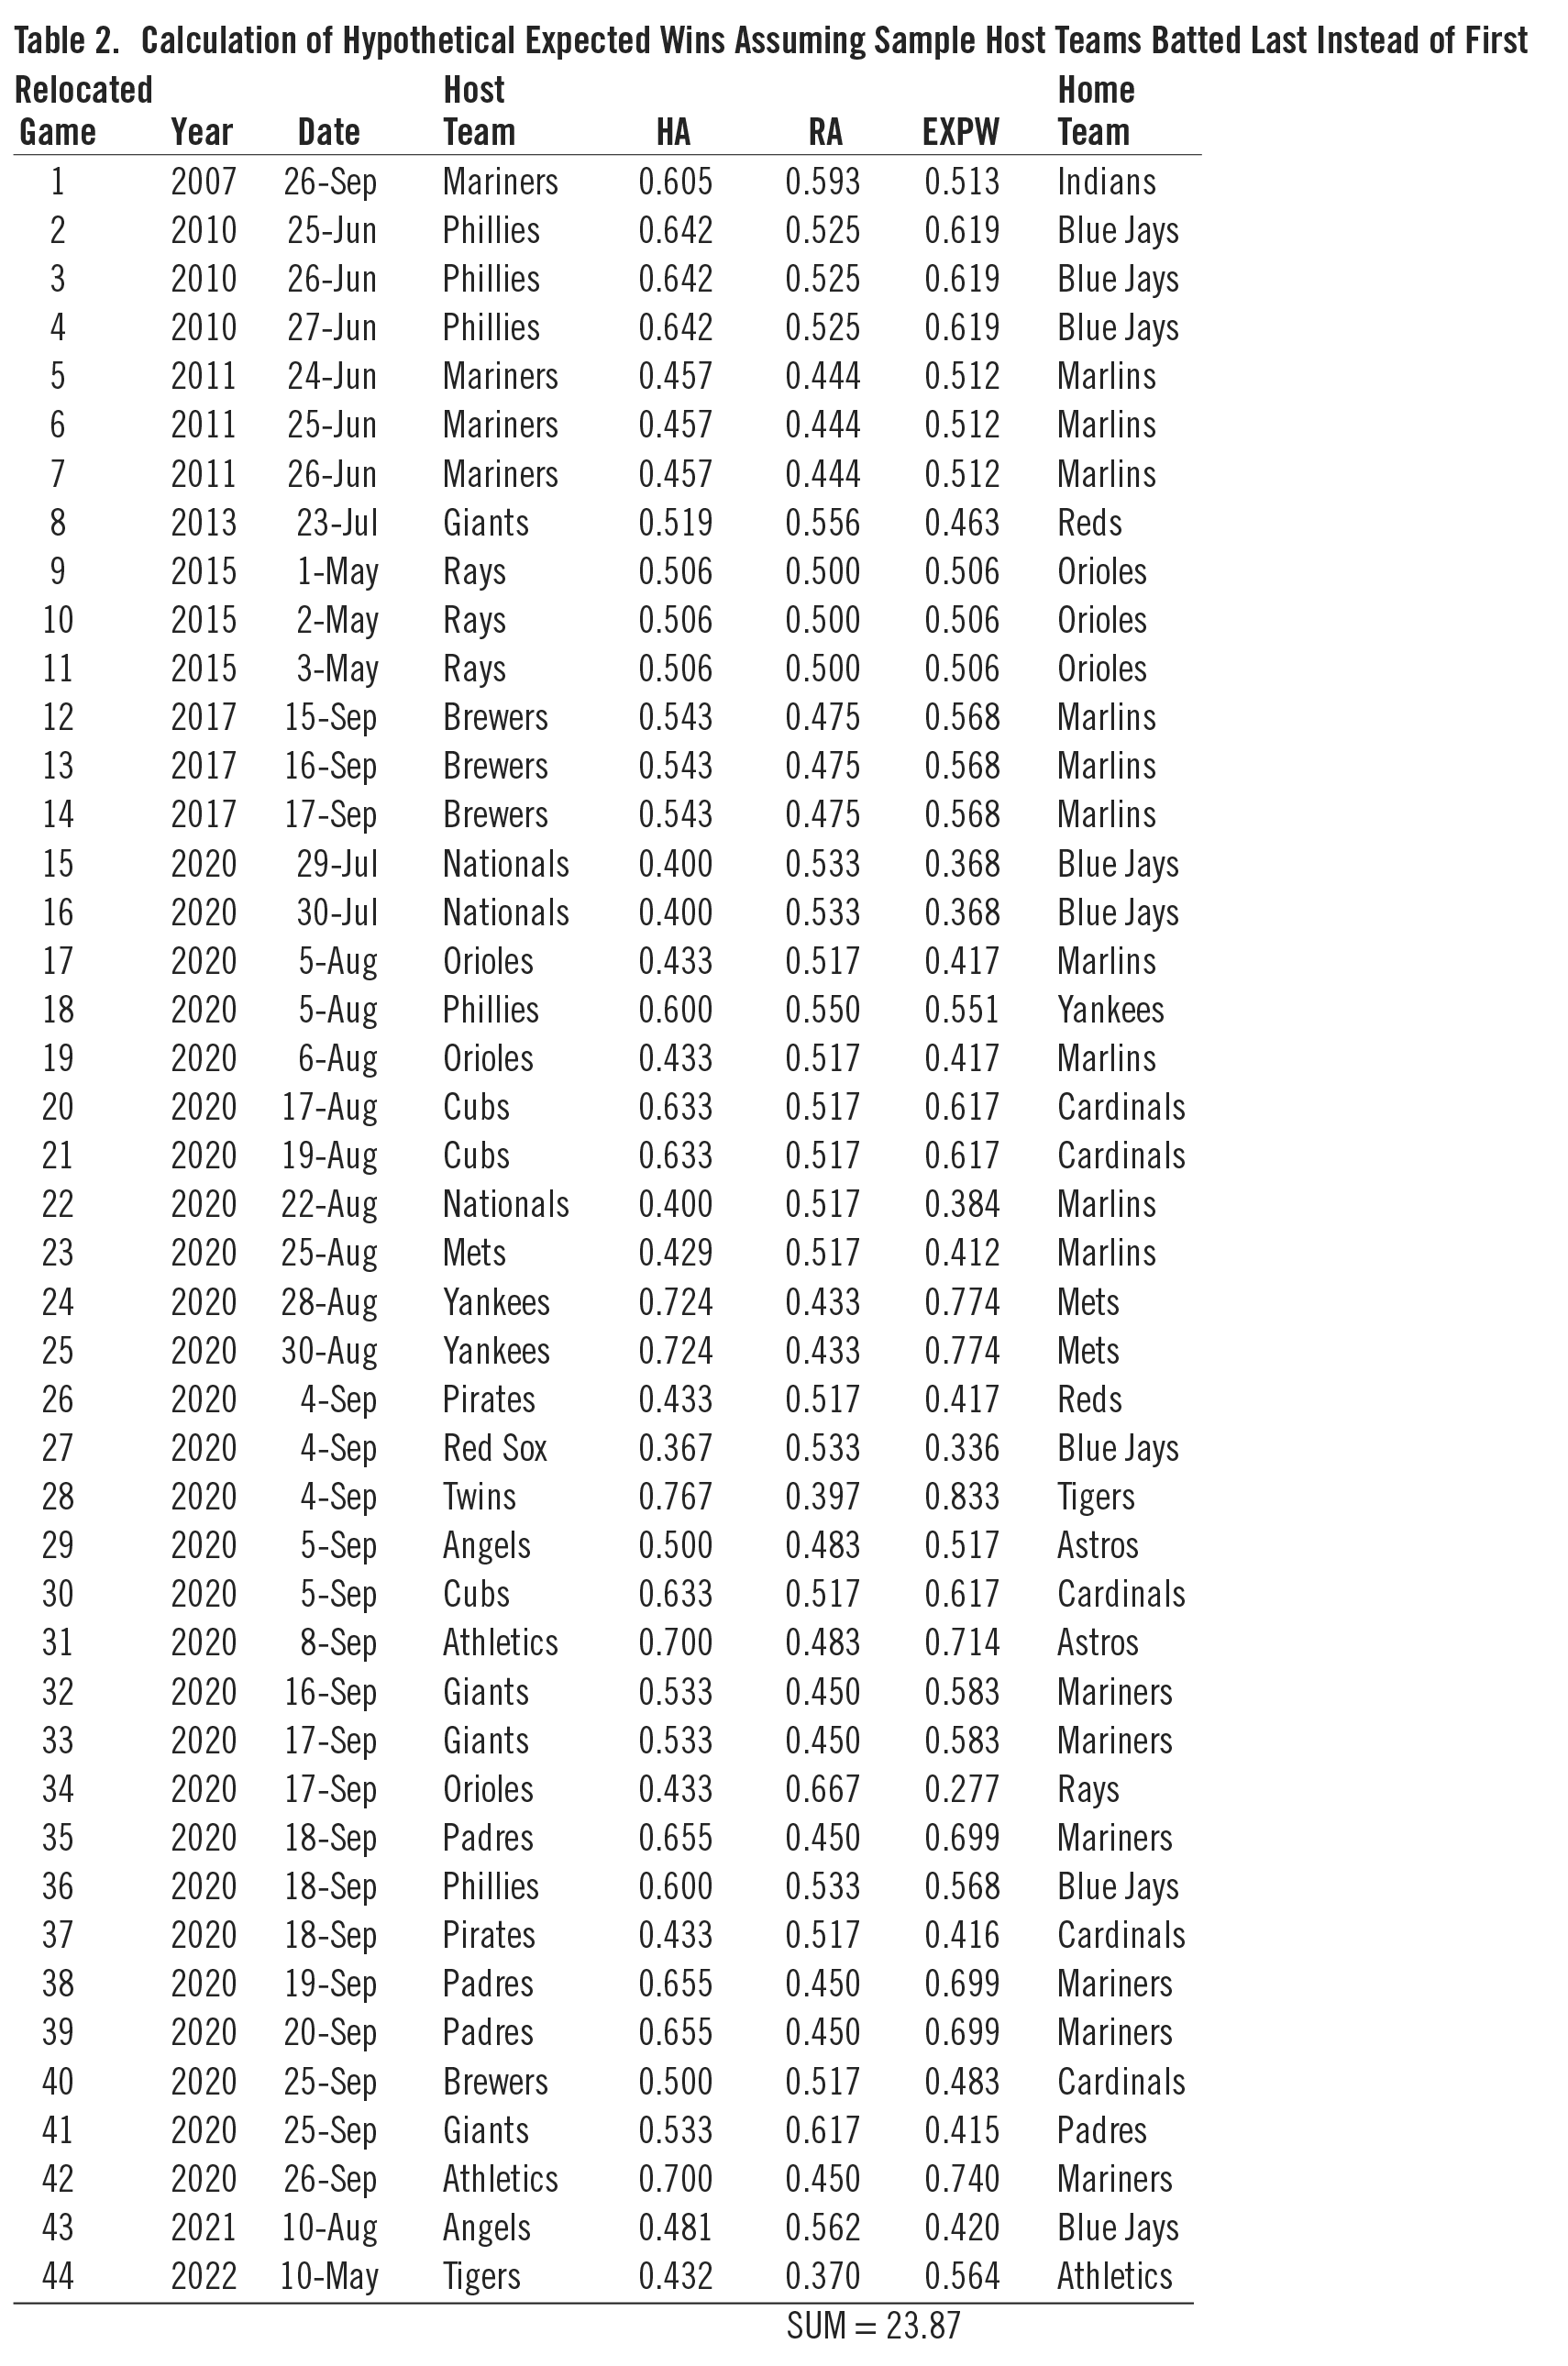
To get the expected total wins in our sample, we sum EXPWG (equation 2) over the 44 games. We are estimating the wins that would have occurred if, for our sample games, the host team had batted last rather than first. Therefore, HA is calculated by removing our sample games from the standard home-road splits because they include all home games, regardless of whether the home team batted first or last.15 This adjustment can be non-trivial during 2020, when the pandemic limited the season to 60 total games and 30 home games for each team. Table 2 shows the calculation of the hypothetical expected total wins assuming that our 44 sample host teams batted last instead of first. The first four columns identify the games and are identical to the first four columns of Table 1. Column five of Table 2 shows the bats-last-only HA in each game for the appropriate host team and season. The sixth column shows the RA for each game’s relocated home team, which equals that team’s season winning average. The relocated home teams are shown in the last column. Column seven shows the expected win value EXPWG for each game, given opponent quality, per equation 2 above.
Summing EXPW over all 44 games gives the total expected wins for our hypothetical bats-last sample. This total is 23.9 wins. We want to compare this to the actual bats-first sample total of 23 wins. The difference of 0.9 is small. But how likely would it be to observe a total of 23 in a sample of 44 games drawn from the bats-last distribution? If it’s not unlikely, then our actual bats-first results could well be from the bats-last distribution, i.e., the two distributions are the same. This would support the hypothesis that outcomes are unaffected by batting order.
Recall that our 44 games are a random sample with respect to team winning averages. Of course, in any particular sample of actual games we cannot observe a fractional win total. Thus, all possible samples will yield an actual number of wins different than the expected value of 23.9. And, in general, given sample variability, individual sample means are unlikely to correspond exactly with the population mean. The question is how large the difference must be to cause us to reject that they come from the same distribution, i.e., that batting last has an impact.
Using the applicable binomial distribution, we can conduct a formal test of the hypothesis that the actual 44-game home-team-bats-first sample comes from the same win distribution as the counterfactual home-team-bats-last sample.16 Using a standard 95 percent confidence level (and a two-tailed test), that hypothesis would be rejected if we observed a win total in our 44-game sample less than 18 or greater than 30.17 Of course, our sample total of 23 is well within that range. In other words, we can be 95 percent confident that our actual sample of 44 home-team-bats-first games is drawn from the same population as the much more common home-team-bats-last games. At the same time, however, there is also a 5 percent probability that we have an unrepresentative sample, i.e., an “outlier” from an HTBF distribution with a significantly different expected number of wins.
SUMMARY AND CONCLUSION
It has long been presumed that, for major-league teams, batting last at home provides an advantage that leads to more victories. However, there has never been any direct evidence of a positive effect because of the almost complete absence of such games since the nineteenth century. However, a new rule in 2007 that requires relocated teams to bat last has changed this, creating 44 games since then in which the team playing in its home park, which we’re calling the host team, batted first. These games were determined randomly with regard to the winning averages of the involved teams, and therefore constitute a natural experiment ideal for statistical analysis.
In these 44 games, the host team batting first won 23 and lost 21. We estimate that if the home team had instead batted last in these games the statistically expected number of wins would on average have been 23.9. The difference is small intuitively, and formal tests based on the binomial probability distribution clearly support the hypothesis that there is no difference in expected game outcomes based on team batting order. While 28 of these games occurred during the pandemic season of 2020, there is no evidence of a resulting statistical bias that might affect our findings. These results are consistent with prior studies of the home team batting first in college baseball.
As time passes, additional data no doubt will be added as more game relocations occur, expanding the sample. But that most likely will be a slow process. Our study period included 16 non-pandemic “normal” years, and only 16 of our random relocation events occurred in those years, exactly one per year on average. However, if MLB is interested in further addressing the issue, it could do so with controlled experiments, perhaps in the minor leagues. For example, team batting orders could be randomly switched during the regular season with a game selection process that minimized possible adverse effects on the competition for playoff spots. In the meantime, these 44 data are all we have, and they do not support a bats-last advantage.
DR. WOODY ECKARD is a retired economics professor living in Evergreen, Colorado, with his wife Jacky. Among his academic publications are five papers on the economics of Major League Baseball. More recently, he has published in SABR’s Baseball Research Journal, The National Pastime, and Nineteenth Century Notes. A Rockies fan, he has been a SABR member for over 20 years.
NOTES
1 Gary Belleville, “The Death and Rebirth of the Home Team Batting First,” Baseball Research Journal 52, No. 1 (Spring 2023), 35.
2 Prior to that, first-last bats were determined by a coin flip, except for a single year, 1877, when the home team was required to bat first. David Nemec, The Official Rules of Baseball: An Anecdotal Look at the Rules of Baseball and How They Came to Be (New York: Barnes and Noble Books and Lyons Press, 1999), 62; and Woody Eckard, “The National League’s 1877 ‘Experiment’ with the Home Team Batting First,” Nineteenth Century Notes (SABR), Bob Bailey, ed., (Summer 2024), 5–7. For a succinct history of the home team batting first, see Belleville, “The Death and Rebirth.”
3 Belleville, “The Death and Rebirth,” 31.
4 Nemec, The Official Rules of Baseball, 63.
5 Theodore L. Turocy, “In Search of the ‘Last-Ups’ Advantage in Baseball: A Game-Theoretic Approach,” Journal of Quantitative Analysis in Sports (February 2008), 1. https://www.researchgate.net/publication/4985998_In_Search_of_the_Last-Ups_Advantage_in_Baseball_A_Game-Theoretic_Approach.
6 In fact, Belleville does not address the issue, stating that “whether or not there is a benefit in batting last is beyond the scope of this paper.” Belleville, “The Death and Rebirth,” 30.
7 Turocy, “In Search of the ‘Last-Ups,’” 2.
8 Gary A. Simon and Jeffrey S. Simonoff, “’Last Licks’: Do They Really Help?,” American Statistician 60, No. 1 (February 2006), 16.
9 Steven R. Bray, Jeff Obara, and Matt Kwan, “Batting Last as a Home Advantage Factor in Men’s NCAA Tournament Baseball,” Journal of Sports Sciences 23, Issue 7 (February 2007), https://www.tandfonline.com/doi/full/10.1080/02640410400022136?, last accessed January 14, 2024.
10 For example, see Nemec, The Official Rules of Baseball, 62.
11 J. Furman Daniel III and Elliott Fullmer, “When the Fans Didn’t Go Wild: The 2020 MLB Season as a Natural Experiment on Home Team Performance,” Baseball Research Journal 50, No. 2 (Fall 2021), 65–73.
12 Yung-Chin Chiu and Chen-Kang Chang, “Major League Baseball During the COVID-19 Pandemic: Does a Lack of Spectators Affect Home Advantage?,” Humanities and Social Sciences Communications 9, 178 (2022), https://doi.org/10.1057/s41599-022-01193-6, last accessed January 27, 2024.
13 Timothy E. Zimmer, Allison Snyder, and Lawrence Bukenya, “American Baseball Fans Do Not Influence Game Outcomes,” Economics Bulletin 41, No. 2 (2021), 741–50.
14 See Bill James, “Pythagoras and the Logarithms,” Baseball Abstract, 1981: 104-110; and Matt Haechrel, “Matchup Probabilities in Major League Baseball,” Baseball Research Journal 43, No. 2 (2014), 118–23. This calculation is commonly referred to as the “log5 method.”
15 The splits are available on Baseball Reference, https://www.baseball-reference.com.
16 The binomial is a discrete probability distribution that applies to a situation with n “trials” (games); two possible outcomes at each trial: “success” (win) or “failure” (loss); and a constant success probability p. In our case, n = 44 and p = .538. The latter is the average of the annual home winning averages based on home-road win splits over 2007–22 available from Baseball Reference. The probabilities for various wins were calculated using Excel’s BINOM.DIST function.
17 Recall that sample means from zero to 44 are possible.