SABR 50 at 50: Analytics
As part of the SABR 50 at 50 project to commemorate the organization’s fiftieth anniversary, SABR offers 50 moments in the evolution of baseball analytics for the past 50 years.
The history of baseball analytics, or sabermetrics, is long and complicated and is filled with many important contributions from analysts, writers, popularizers, books, websites and corporations. The 50 selected moments, or events, are ones we thought would best tell the story of the past half century in this ever-changing field since SABR’s founding in 1971. The next 50 years promises to be just as busy.
We invite you to read the list and the short description for each of the entries. Click on the title to read stories from the SABR Research Collection archives or other baseball authors about these moments.
— Compiled by Mark Armour, with contributions from Phil Birnbaum, Scott Bush, Sean Lahman, Allison Levin, Rob Neyer, Pete Palmer, Jacob Pomrenke, Cory Schwartz, Mark Simon, Tom Tango, Keith Woolner, Don Zminda, and Chris Dial

SABR is founded (1971)Although statistical analysis of some form had been done by baseball observers over the years, the formation of SABR by L. Robert “Bob” Davids and 15 other “statistorians” at the National Baseball Hall of Fame in Cooperstown on August 10, 1971, and the creation of SABR’s Statistical Analysis Committee soon afterward formalized a community of people who could share ideas. The committee’s founding members were Bill James, Pete Palmer, and Dick Cramer. |

Batter’s Run Average / OPS (1974)In a groundbreaking article for SABR’s Baseball Research Journal, Dick Cramer and Pete Palmer described a new metric called Batter’s Run Average, which was on-base-percentage times slugging percentage (OBP x SLG). Eventually, they agreed that using addition instead of multiplication (OBP + SLG) would make an easier calculation without much loss of correlation with runs scored. Hence, OPS. |
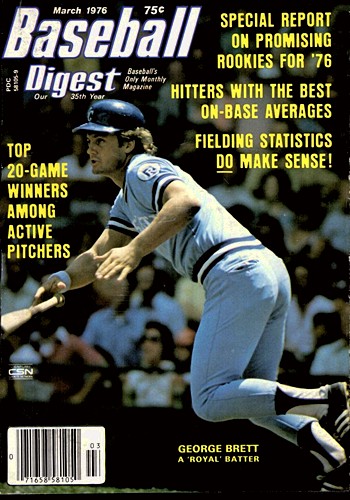
Range Factor (1976)In a March 1976 article for Baseball Digest (“Fielding Statistics Do Make Sense!”), Bill James advocated using a fielder’s range (plays made per game) rather than fielding percentage. Many advances have followed, but all are predicated on the idea that a fielder should be measured by the plays he makes rather than the plays a scorer felt he should have made (errors). |
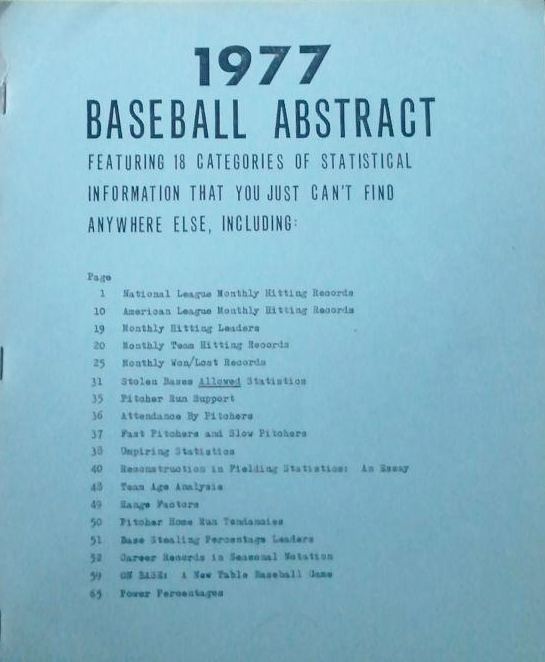
Bill James Baseball Abstract (1977)In 1977, Bill James self-published the first edition of what became 12 popular annual journals, each of which was groundbreaking and could stand as its own entry on this list. In its first five years, the Abstract introduced his readership to runs created, park effects, replacement value, the defensive spectrum, the Pythagorean formula, the “favorite toy,” and player aging curves. In the 1980 Abstract, James coined the phrase “sabermetrics.” |

Do Clutch Hitters Exist? (1977)Writing in the 1977 Baseball Research Journal, Dick Cramer published the first formal study claiming that hitting in the clutch is not a repeatable, or predictable, skill. It took many more years before this view became prevalent, but articles or commentary advocating for clutch hitting are a rare breed today. |
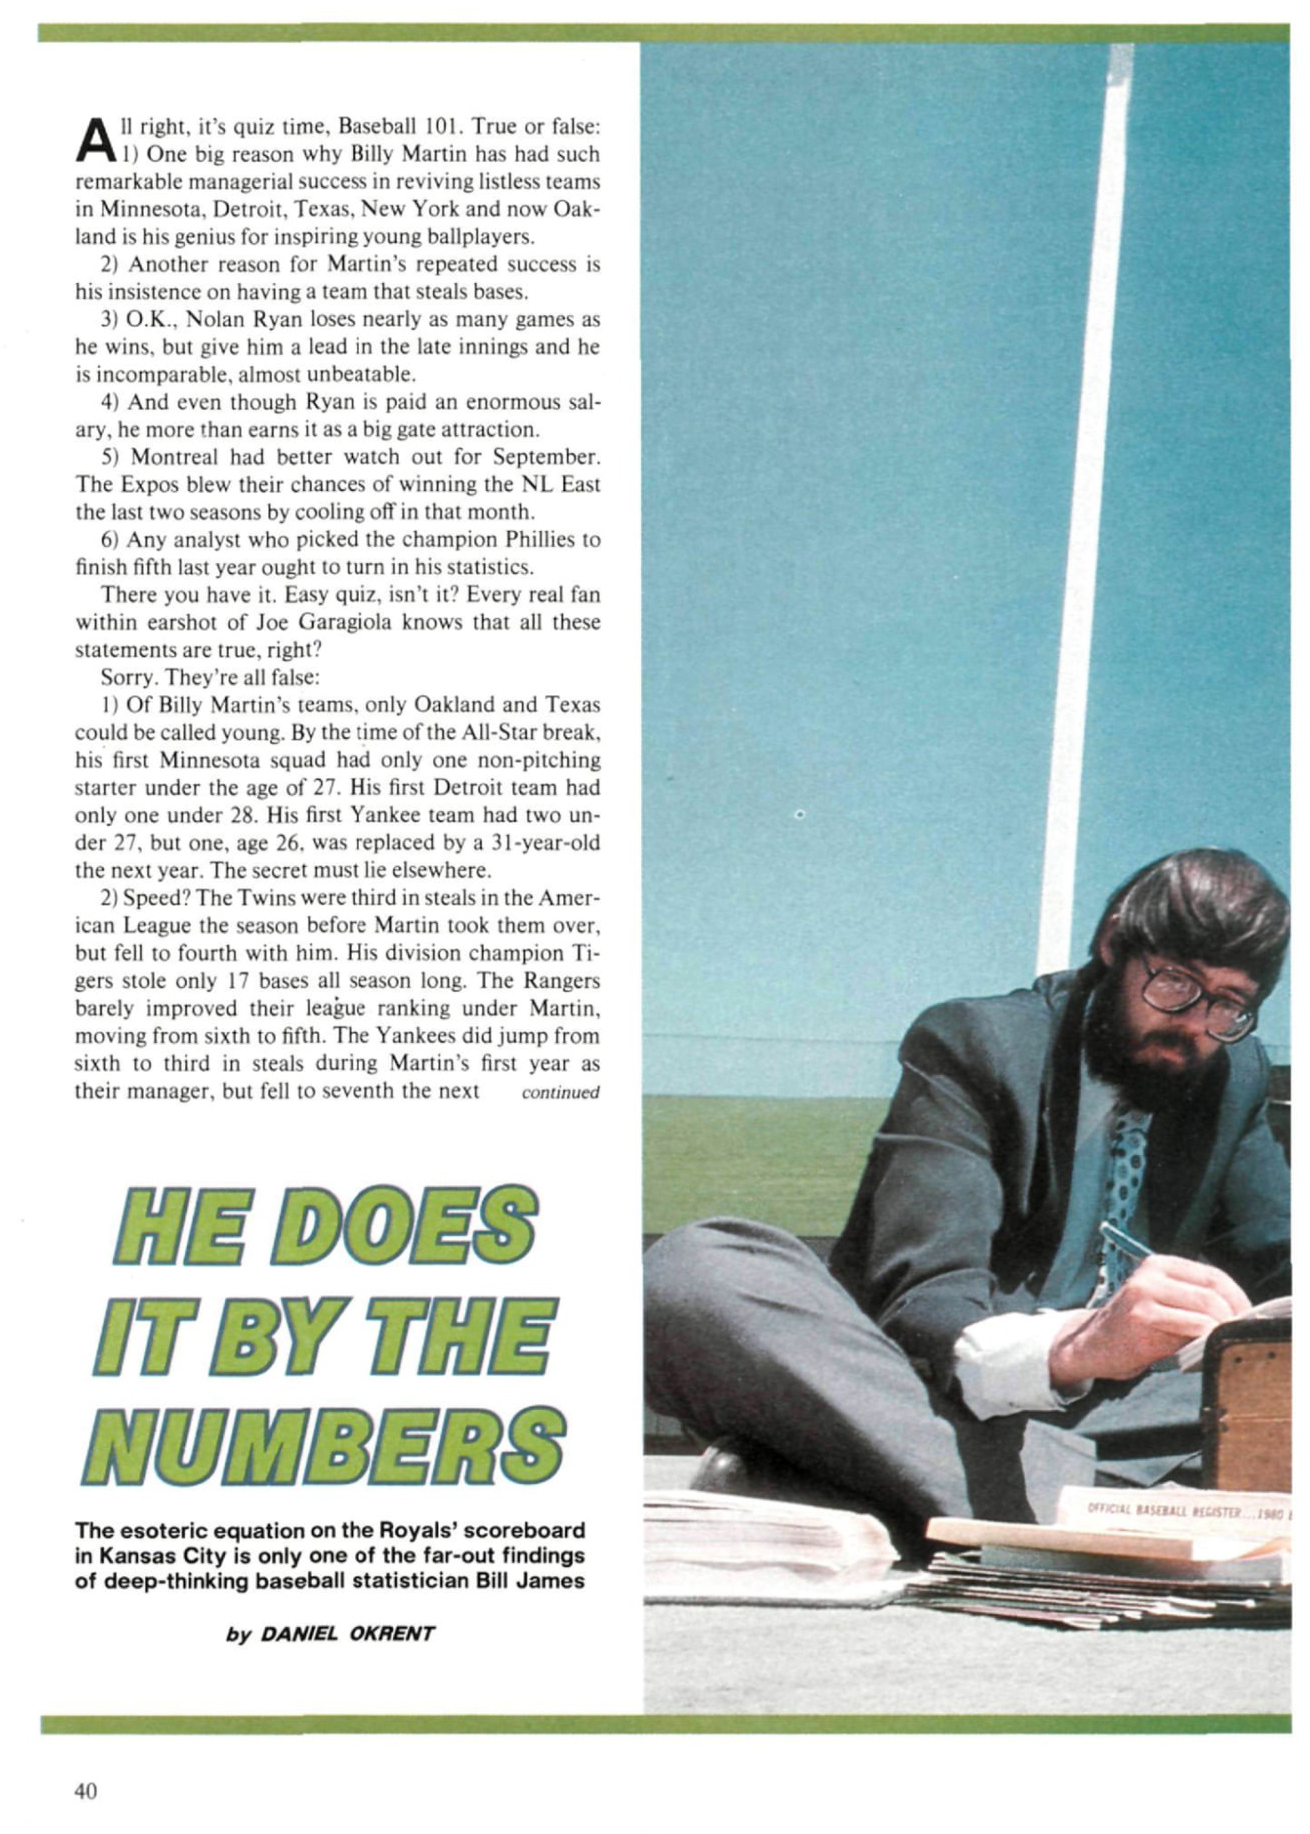
Dan Okrent’s Sports Illustrated profile of Bill James (1981)As great as the annual Abstracts were, Bill James’s audience was still fairly small — a few dozen people at first. In the May 25, 1981 issue of Sports Illustrated, Dan Okrent profiled James in an article titled “He Does It By The Numbers,” and suddenly the secret was out. For the next seven years (1982-88), James’s Baseball Abstract was published by Ballantine and became an annual best-seller. |
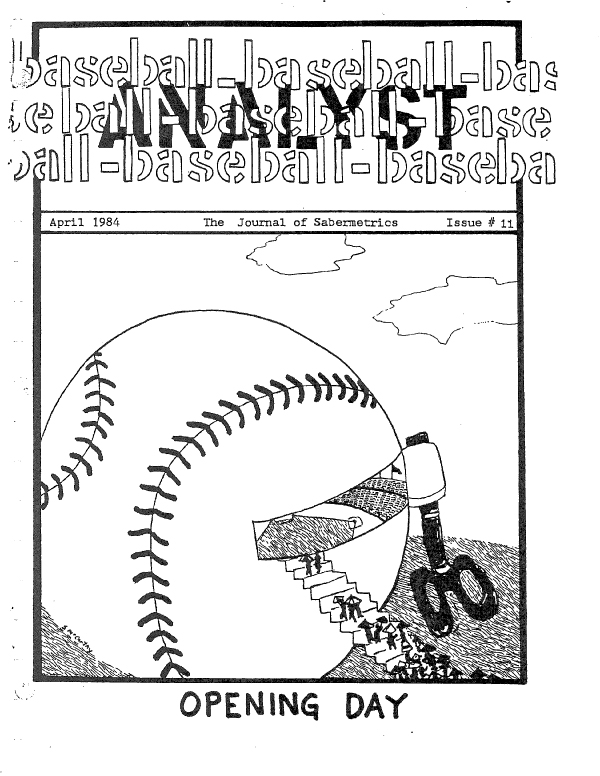
Baseball Analyst (1982)In June 1982, James began publishing a new “journal” called Baseball Analyst, a collection of hand-typed sabermetric articles that he called a “discussion among friends.” The writers, besides James himself, were his Abstract readers, including Craig R. Wright, Pete Palmer, Jim Baker, and many more. James promised to keep it going as long as people sent him material. It lasted seven years and 40 issues. |
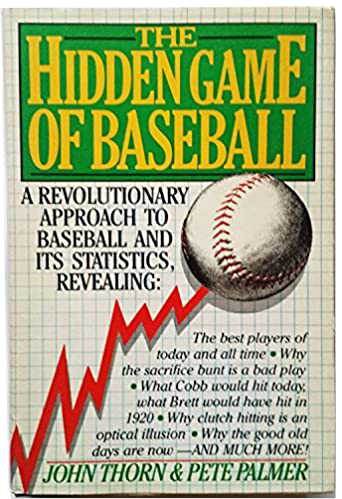
The Hidden Game of Baseball (1984)Written by John Thorn and Pete Palmer, this seminal work provided a history of sabermetrics, presented new formulas for evaluating players and situations (including Palmer’s groundbreaking Linear Weights and Total Player Rating), and challenged how we thought about the game. |
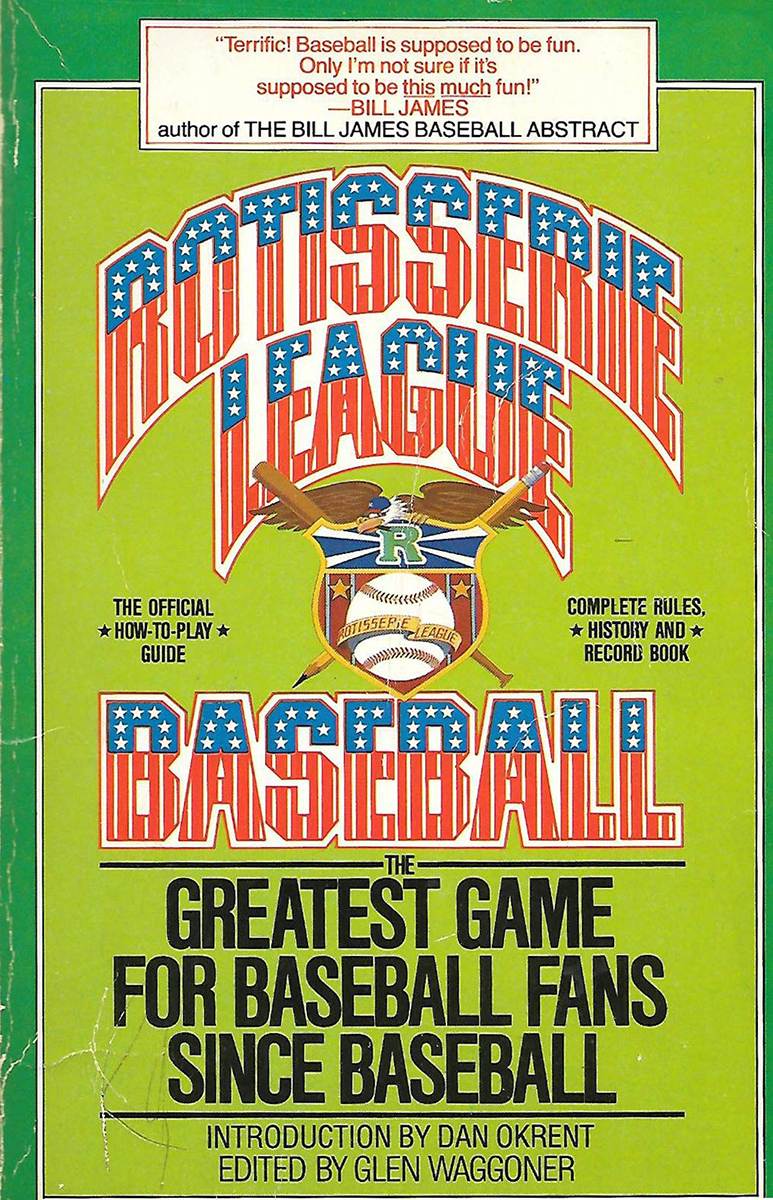
Rotisserie League Baseball (1984)In 1980 Dan Okrent and several of his friends invented a baseball league that allowed “owners” to draft players and be scored based on how the players performed in the real world. Okrent wrote a 1981 Inside Sports article about it, and the game started to catch on. This 1984 book, edited by Glen Waggoner, provided rules, a constitution, and several essays. From there, the entire industry of fantasy sports sprung up, creating a nation of fans who believed they could be a big-league general manager. |
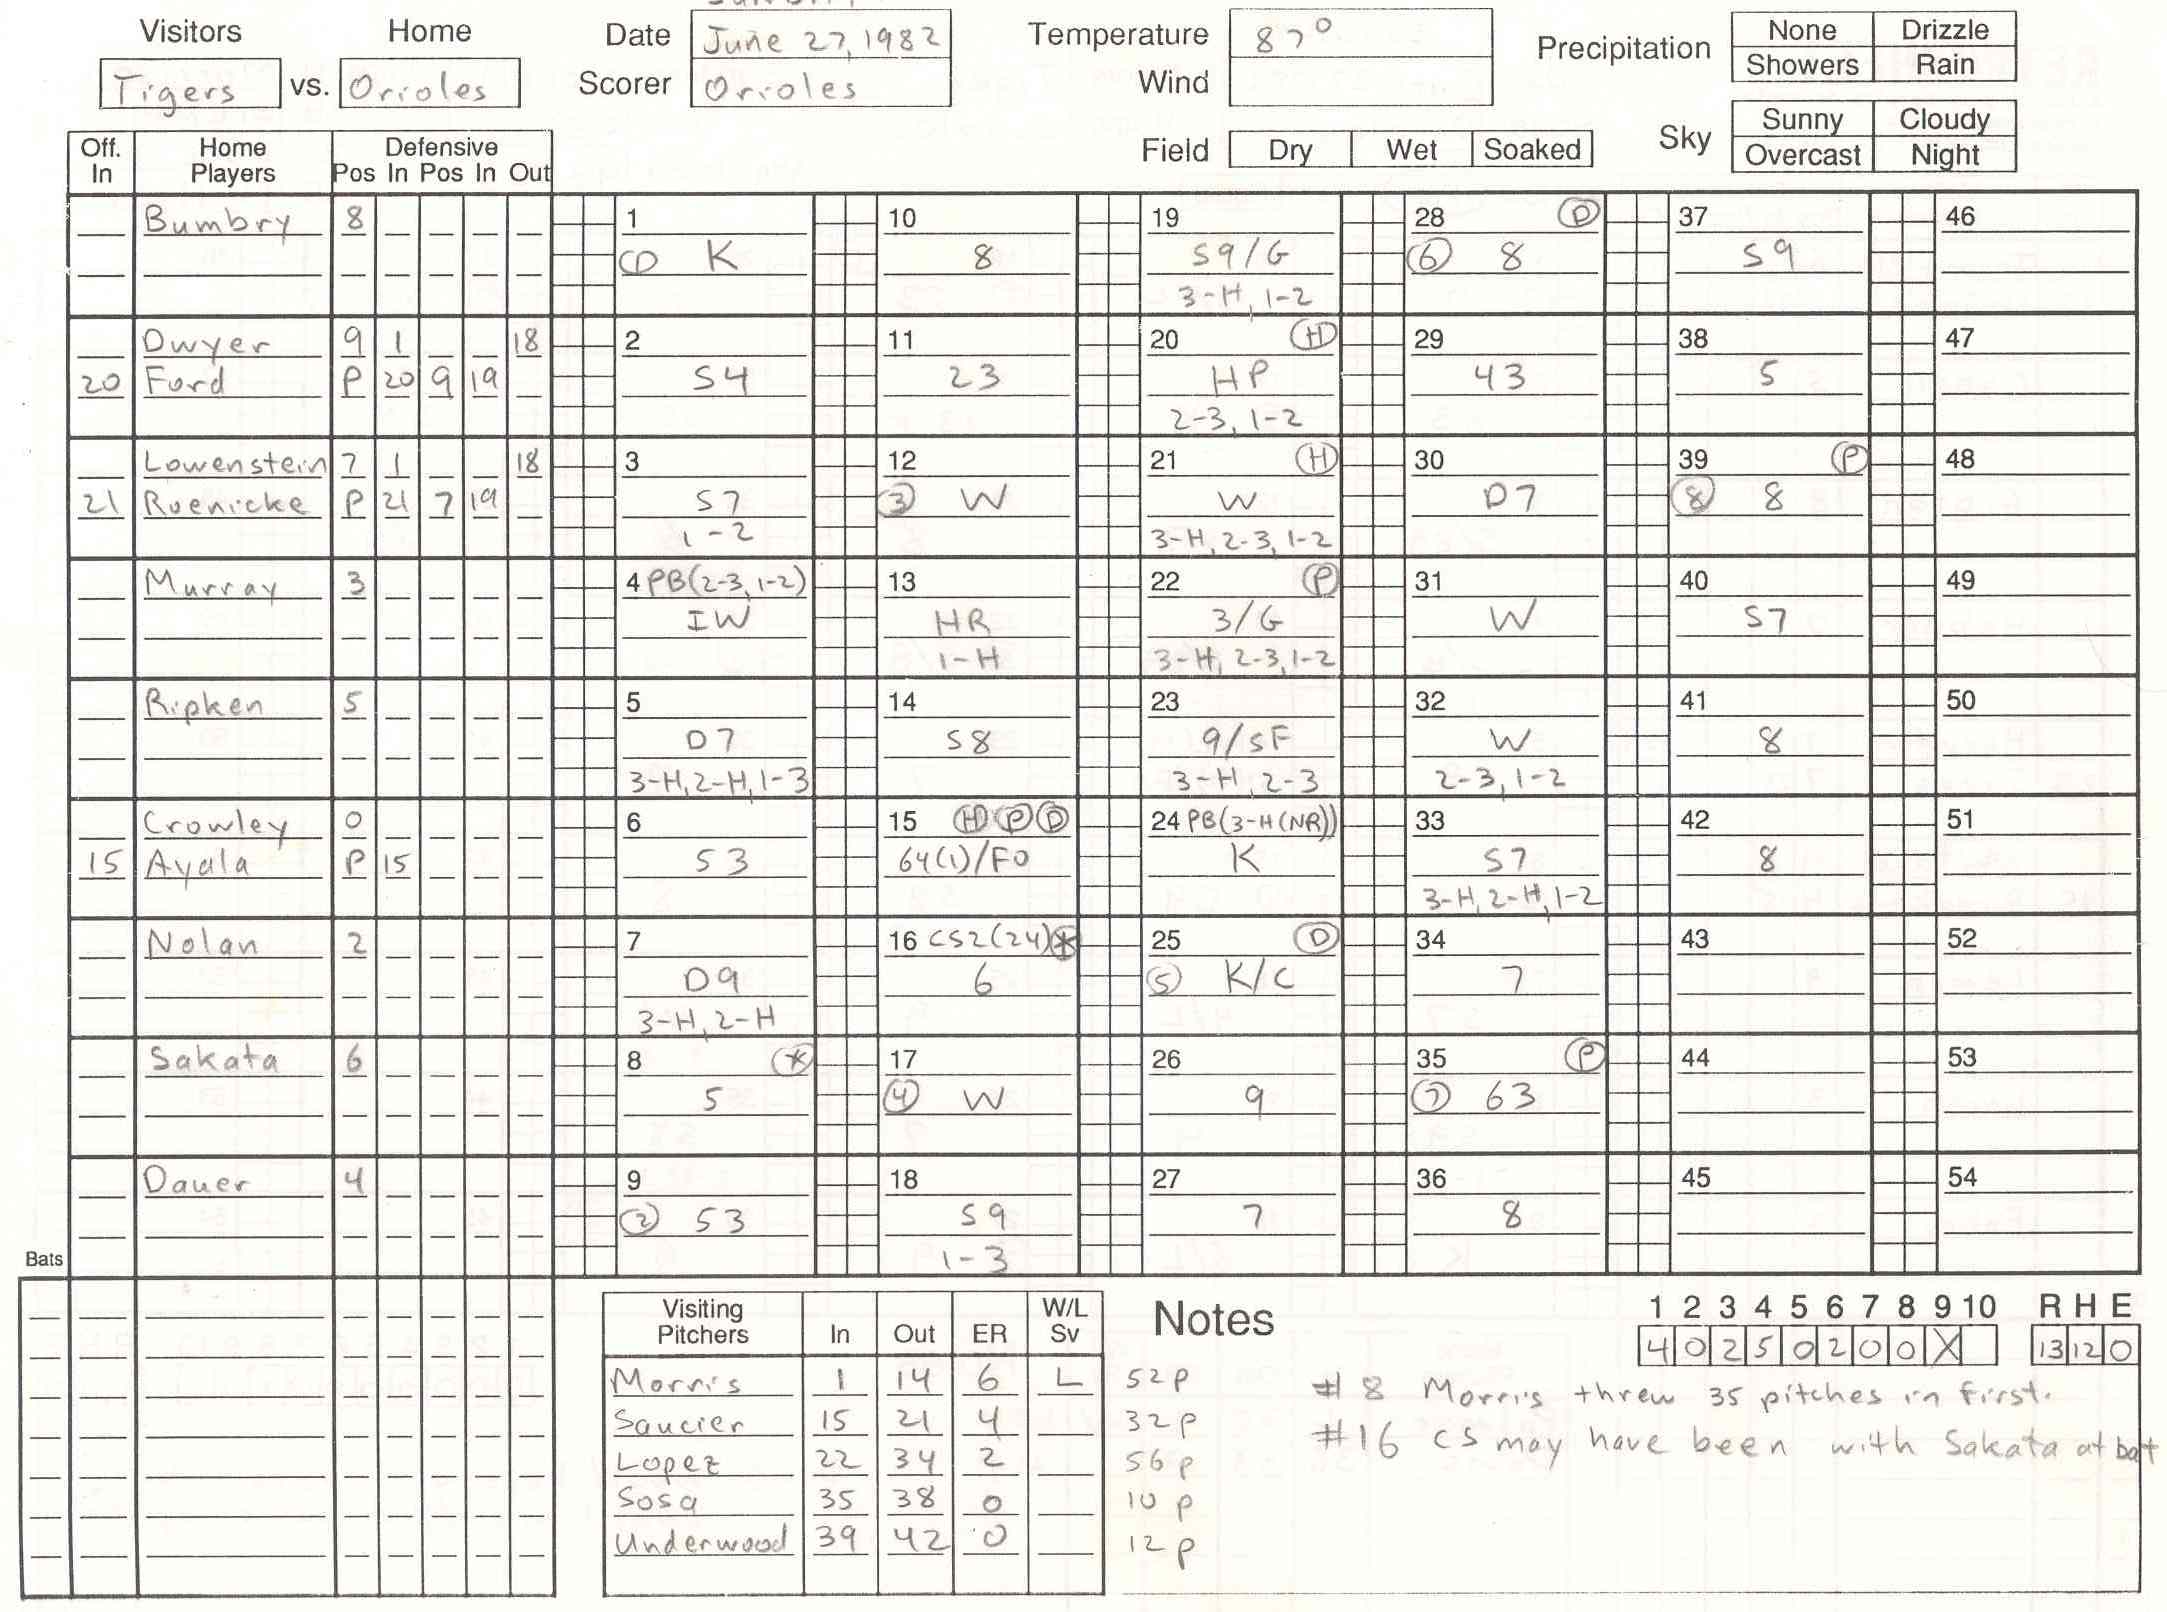
Project Scoresheet (1984)In order to do in-game analysis, you need play-by-play data. Bill James had tried for years to get major-league data from the Elias Sports Bureau, keeper of MLB’s official statistics. In response, James created Project Scoresheet as a community of volunteers to keep score using a system that could be easily converted to a digital format. His proposal for the project first appeared in the October 1983 issue of Baseball Analyst. |
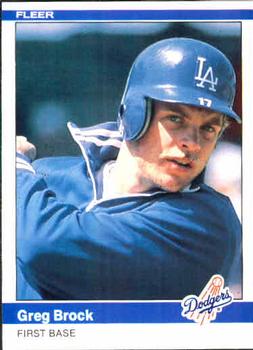
Brock2 system (1985)Introduced in the 1985 edition of the Baseball Abstract, Bill James claimed that Brock2 was the most important research he had ever done. Brock2 was a system to translate minor-league statistics to major-league equivalences, launching what remains a vibrant area of sabermetrics. James was breaking new ground every year, but this one in particular deserves to be broken out. |
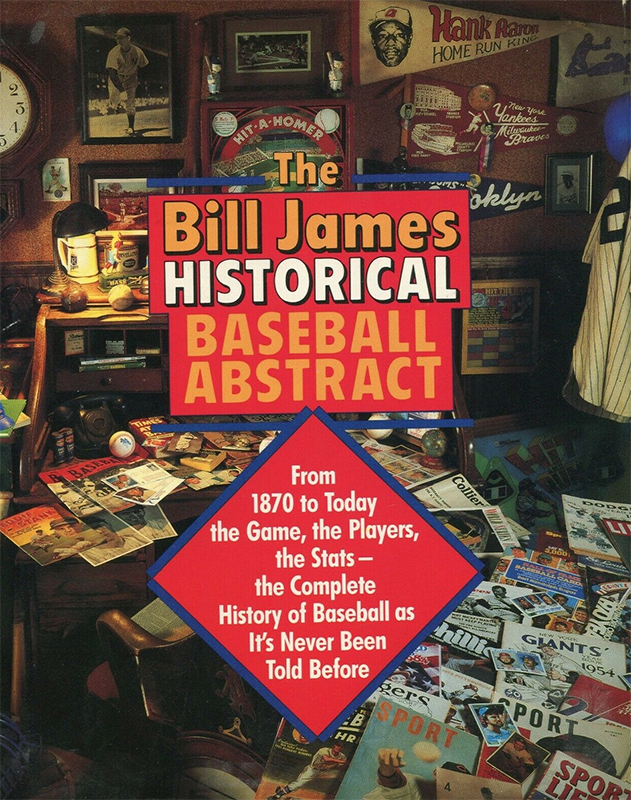
Bill James Historical Baseball Abstract (1985)In this thick reference book, James applied the lessons he had explored in his annual Abstracts to all of baseball history, providing a highly readable and endlessly fascinating tour through prior decades and his detailed explanation of the best 100 players in history. In sum, a masterpiece of a book. He published a revised edition in 1988 and an entirely new edition in 2001. |

STATS, Inc. (1988)Now known as Stats Perform, this Chicago-based sports data and analysis company was founded by Dick Cramer and Steve Mann in 1981 to collect MLB data to market to teams. Repurposed after the 1987 demise of Project Scoresheet by Cramer, Bill James, and John Dewan, the company took up the mantle of scoring every major-league game and utilizing the resulting play-by-play data. |

rec.sport.baseball (1989)Usenet, an Internet discussion system launched in 1980, became a hotbed for baseball discourse in the late 1980s and peaked in the mid-1990s. The main baseball page had dozens of new threads a day — many of them analytical, many of them heated — and it acted as a petri dish for a generation of young analysts who went on to write for Baseball Prospectus, Baseball Think Factory, FanGraphs, and other influential outlets. |
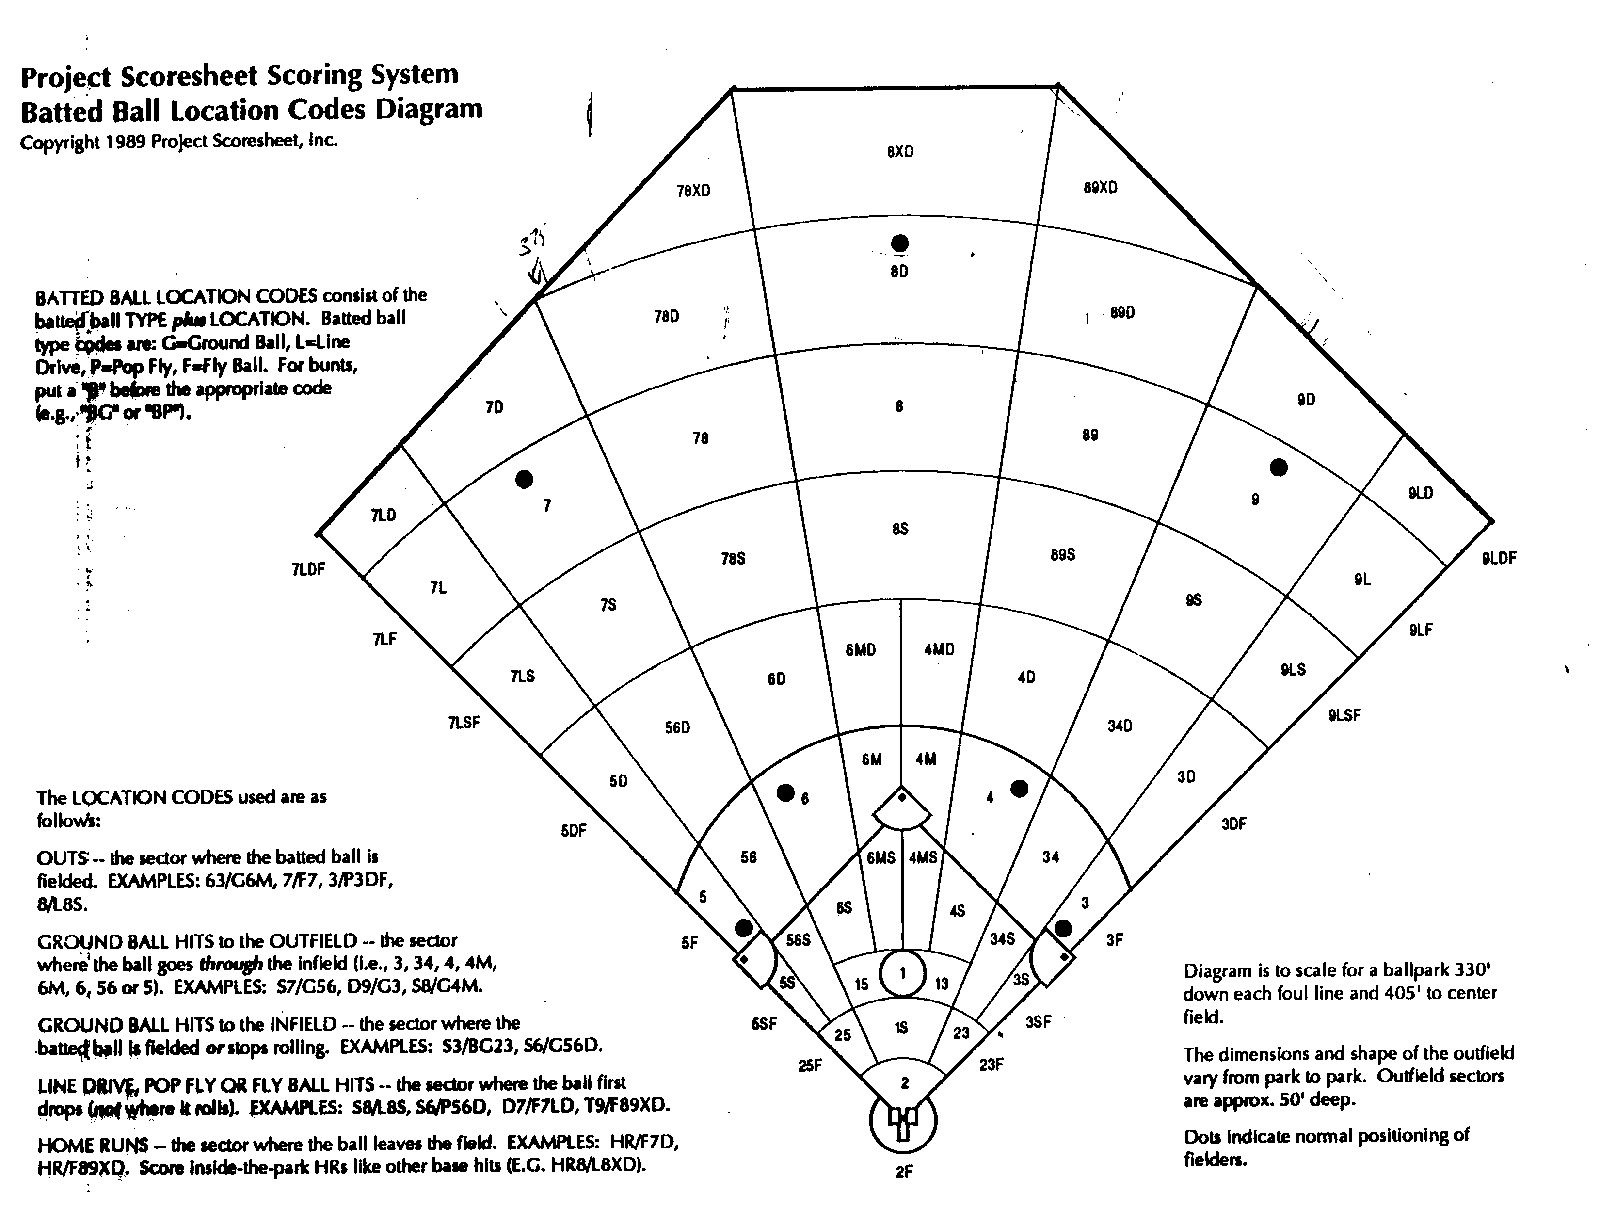
Retrosheet is founded (1989)A nonprofit organization founded by David W. Smith, Retrosheet’s stated goal was to digitize the play-by-play for baseball games from the past. Using Project Scoresheet’s scoring system as a model, gathering scoresheets from writers, teams, and fans, and finding accounts in newspapers throughout the country, Retrosheet.org has grown to house more than 185,000 complete play-by-play accounts in its freely available database. |
Defensive Average (1989)Devised by Pete DeCoursey and Sherri Nichols, DA was the first defensive metric to measure a fielder’s likelihood of making plays on balls hit into his “zone” (as recorded by Project Scoresheet’s scorers). Although Nichols stopped work on DA in 1996, both Chris Dial’s Runs Effectively Defended (RED) and Mitchel Lichtman’s Ultimate Zone Rating (UZR) are built off Defensive Average. |
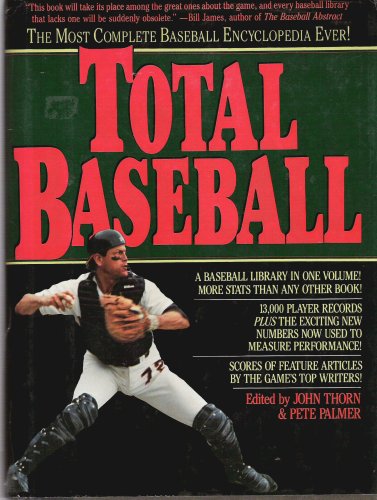
Total Baseball (1989)MacMillan’s Baseball Encyclopedia published the first of several editions in 1969, but John Thorn and Pete Palmer advanced the ball considerably with Total Baseball. Among the improvements: National Association (1871-75) statistics, better seasonal summaries, and all of Palmer’s linear weights-based statistics. |
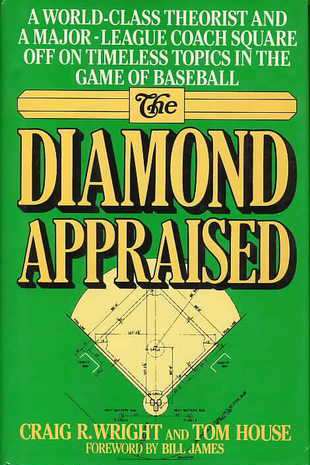
The Diamond Appraised (1989)In this well-received book, Craig R. Wright, a pioneering analyst for a number of teams in the 1980s and 1990s, and Tom House, Texas Rangers pitching coach, debated their ideas on baseball, including how pitchers should be used, how to measure catcher’s defense, and whether baseball needed more knuckleballers. |
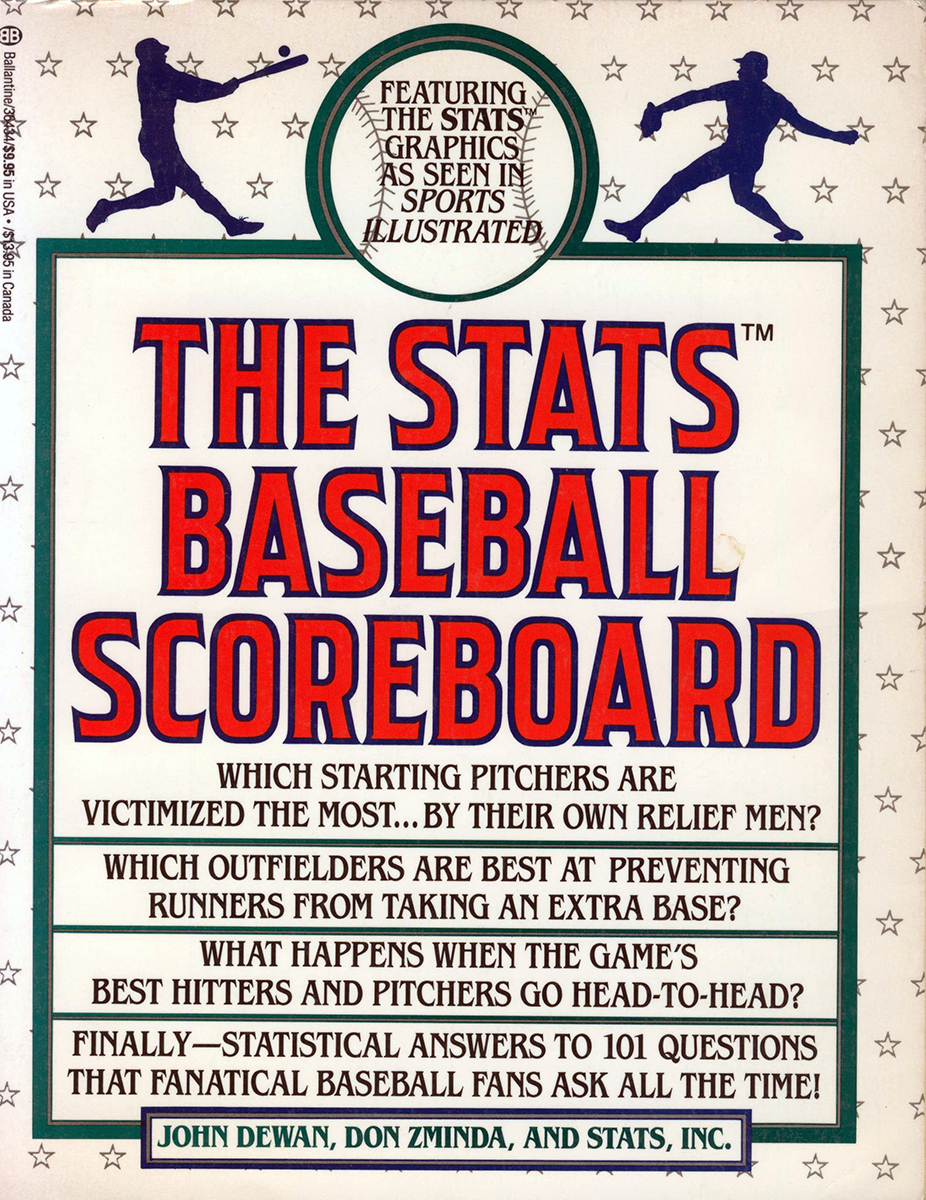
STATS Baseball Scoreboard annuals (1990)Using its own play-by-play data, STATS, LLC began publishing books in 1990. For baseball analysts, the most important of these was the STATS Baseball Scoreboard, a book of analytical essays that was devoured by fans in the years after Bill James ended his Baseball Abstract. In the 1991 book, John Dewan introduced Zone Rating, a zone based defensive measure utilizing STATS play by play data. |
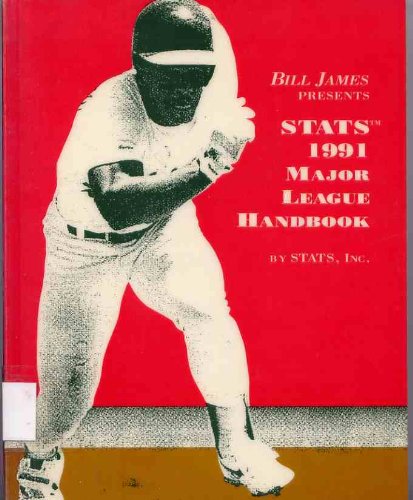
Bill James’s STATS Major League Handbook (1990)Now known as the Bill James Handbook and published by ACTA, this annual is still going strong after more than 30 issues. Filled with complete career stats for every player, statistical leaderboards, and original essays, the handbook comes out just a few weeks after one season has ended and acts as a jumpstart for the next. |
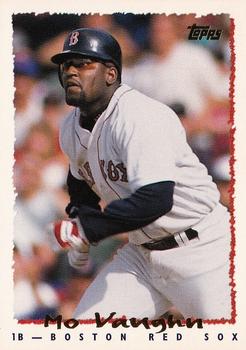
Value Over Replacement Player (1995)Keith Woolner first introduced Value Over Replacement Player on a Boston Red Sox mailing list, then fleshed it out on rec.sport.baseball and at Baseball Prospectus. VORP established a framework for measuring a replacement player, and a context-adjusted run value for both hitters and pitchers. |

Rob Neyer at ESPN.com (1996)For many years ESPN had the best and most popular baseball website on the Internet, and Rob Neyer’s column, employing the growing language of sabermetrics, was a must-read for a generation of analytically-minded fans. Many of today’s smartest sportswriters and TV/radio analysts cut their teeth reading Rob during his 15-year run at ESPN. |
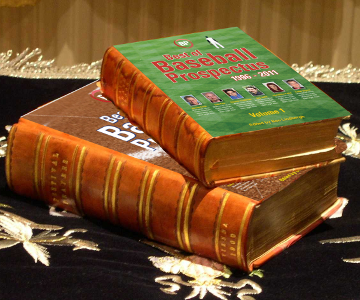
Baseball Prospectus is formed (1996)Started by Gary Huckabay with a group that came together on rec.sport.baseball, BP put out its first annual in 1996, and launched its website in 1997. Both are still going strong, and several of its alumni (Christina Kahrl, Joe Sheehan, Keith Woolner, Nate Silver, and more) are now working in front offices and prominent media outlets. |

Lahman Baseball Database (1996)Sean Lahman first published a free, downloadable database that contained individual and team statistics back to 1871. While Lahman and others had previously released smaller datasets online, his database allowed researchers to perform complex queries across the entire history of the game for the first time. Much of the underlying data was scraped from a digital version of Total Baseball released on CD-ROM in 1994. |
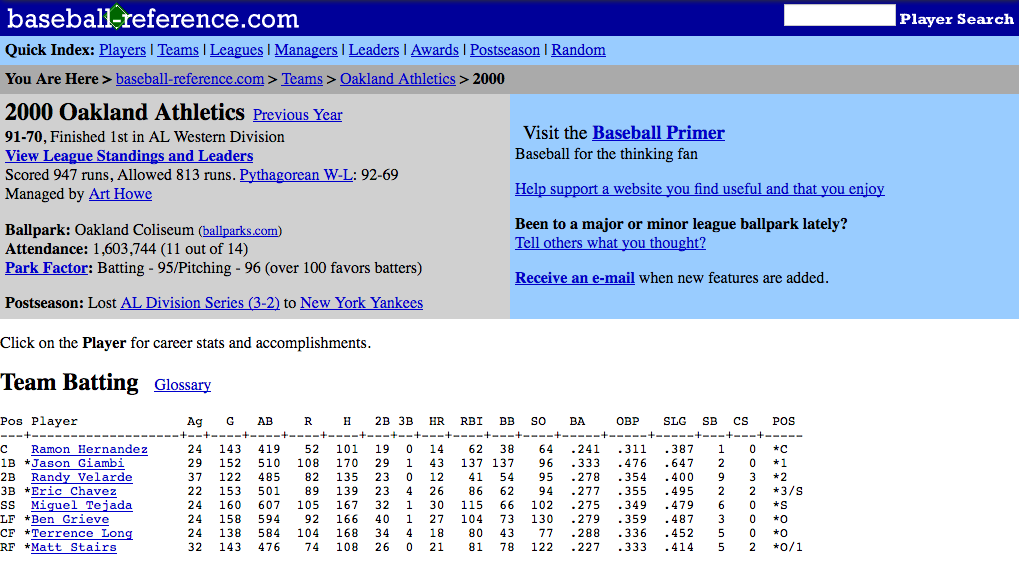
Baseball-Reference.com launches (2000)Utilizing statistics gleaned from Total Baseball, Sean Forman launched his online baseball encyclopedia in April 2000. In ensuing years his company has added data for the minor leagues, Negro Leagues, and Japanese leagues, box scores and game logs (using Retrosheet data), amateur draft results, transactions, and essentially everything you can imagine. In 2007, the site introduced Play Index (now known as Stathead), an interface that allowed users to perform simple queries on their database for seasons or games. |

Baseball Think Factory (2001)Launched as Baseball Primer by Jim Furtado and Sean Forman and renamed in 2004, the site hosts smart baseball talk, and has been an incubator for some of the game’s best analysts (Tom Tango, Dan Szymborski, Chris Dial, etc.) Its Hall of Merit, an on-field-only alternative to the Hall of Fame created by Joe Dimino, has been enshrining players since 2002, and is also a must-read conversation with thousands of informative posts. |

Defense-Independent Pitching Stats (2001)First hashed out on rec.sport.baseball in 1999, and published at Baseball Prospectus two years later, Voros McCracken’s seminal pitching metric DIPS focused only on events upon which pitchers have the most control (walks, strikeouts, home runs, and hit batsmen) and not on balls in play over which, McCracken proposed, the pitcher had no control. Further advances have added other factors, but this was a game-changer in the sabermetric community. |

Win Shares (2002)A book written by Bill James and James Henzler, defining James’ new statistic of the same name, and including dozens of articles that demonstrate its value. Although others had dabbled with all-encompassing stats prior to Win Shares, and although it has been surpassed in popularity by the various versions of WAR, James’s precision and typically lively writing pushed the ball along as he so often did. |
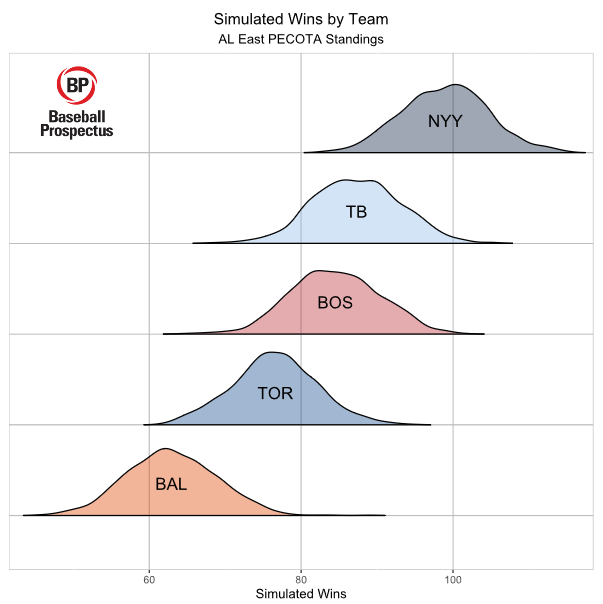
PECOTA (2003)An acronym for Player Empirical Comparison and Optimization Test Algorithm (and a humorous nod to journeyman Bill Pecota), PECOTA is a player forecasting system that uses historical statistically comparable seasons to predict future performance. Its creator was Nate Silver, who introduced it in Baseball Prospectus 2003, and managed it for BP until 2009. |

Moneyball (2003)Written by Michael Lewis, focusing on the Oakland A’s use of evidence-based sabermetric thinking to run their baseball operation, the book was a huge best-seller that greatly expanded the audience for analytics. While there was significant pushback from scouts and writers, its thinking is all over baseball, and every other sport, today. The 2011 film starring Brad Pitt didn’t hurt either. |
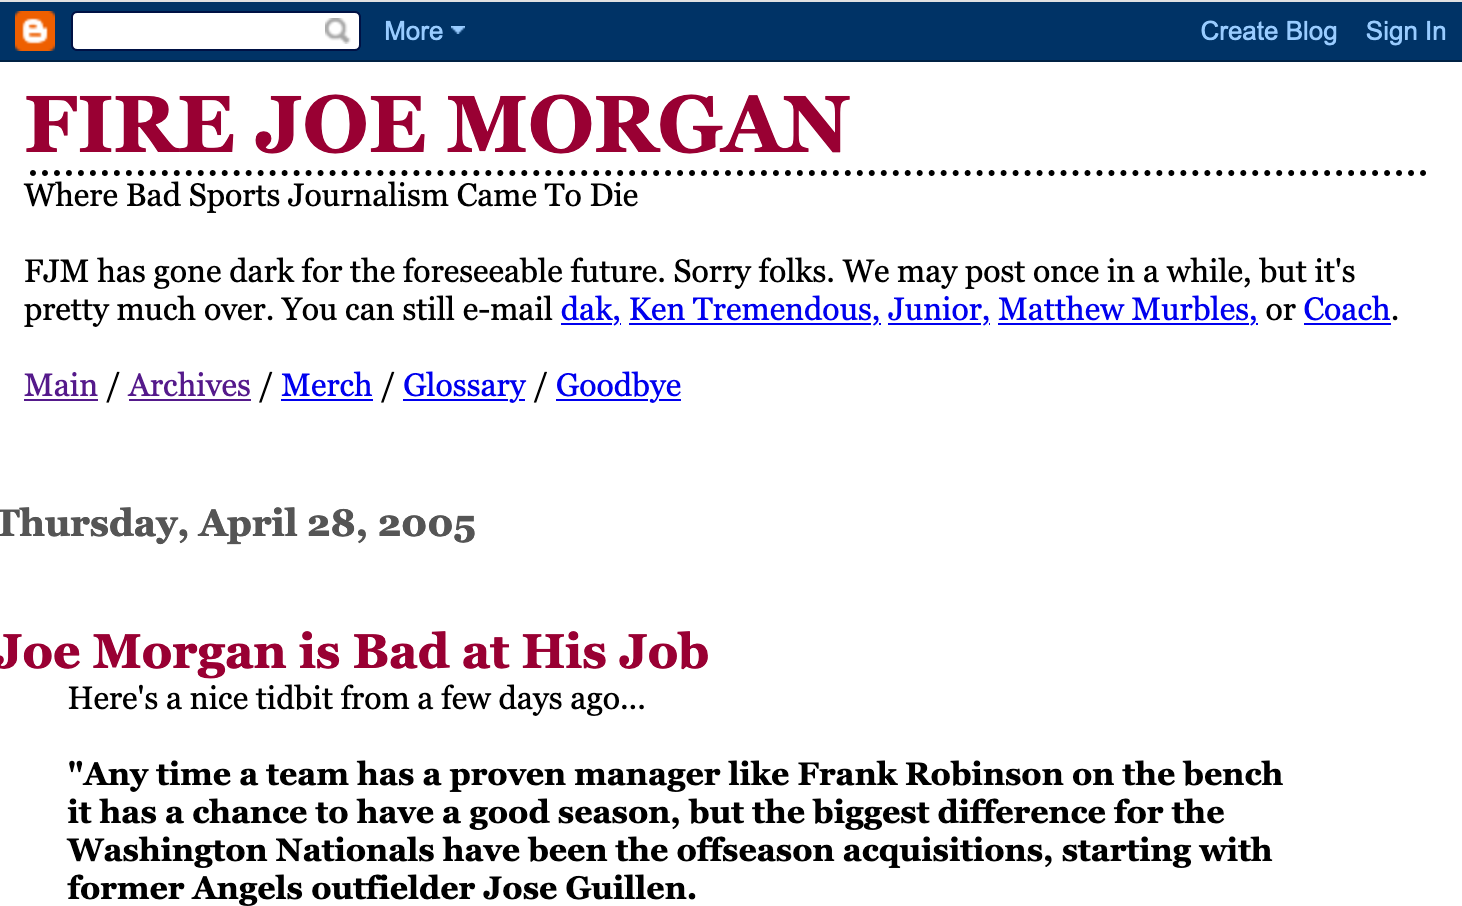
FireJoeMorgan.com (2005)Michael Schur (writing under the pen name Ken Tremendous), Alan Yang (junior), and Dave King (dak) created this popular blog to lampoon baseball writing and commentary. The site championed modern analysis and blasted old-school cliché-ridden thinking. Hall of Famer Joe Morgan, a national television analyst at the time, was a frequent, but by no means sole, target. |

FanGraphs launches (2005)Created by David Appelman, with a rotating array of influential baseball writers who have gone on to work for major-league front offices and media outlets, FanGraphs contains articles and analysis on both current and historical events and players, fantasy commentary and analysis, and a statistical record covering the history of the game. FanGraphs also provides statistics to media outlets and teams. |
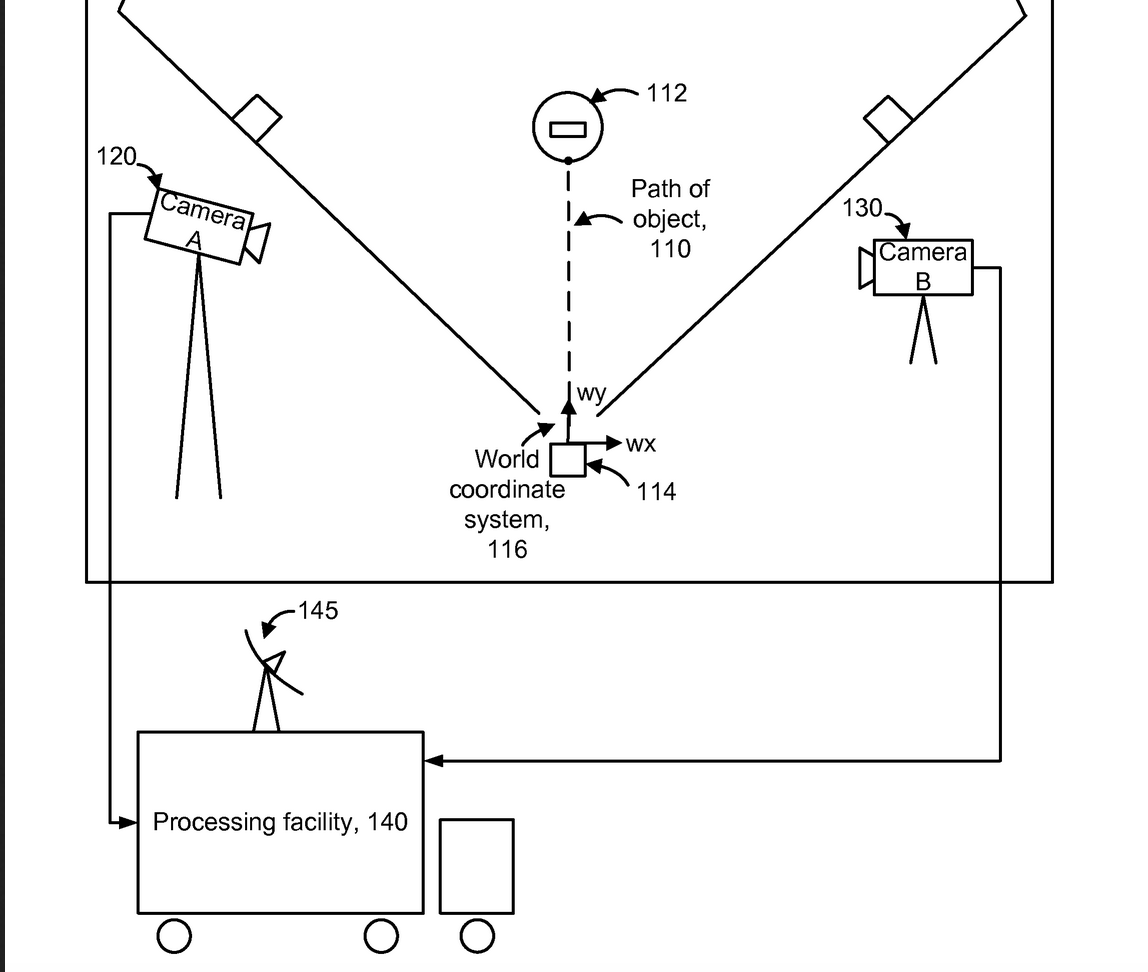
PITCHf/x (2006)Developed by Sportvision and implemented league-wide by Major League Baseball, PITCHf/x was a camera-based system that measured pitch speeds and trajectories from release to home plate. The data has been used to measure pitcher’s velocity and break, and to provide feedback to umpires on their performance. |
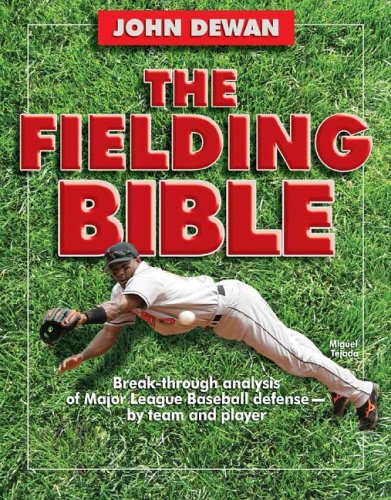
Fielding Bible Awards introduced (2006)After years of dissatisfaction within the sabermetric community about the annual Rawlings Gold Glove Awards, Baseball Info Solutions began making its own annual selections. Informed by BIS’s own defensive metrics (including the zone-based Defensive Runs Saved, or DRS), the analytically minded voting body has included BIS founder John Dewan, Bill James, Rob Neyer, and Joe Posnanski. |
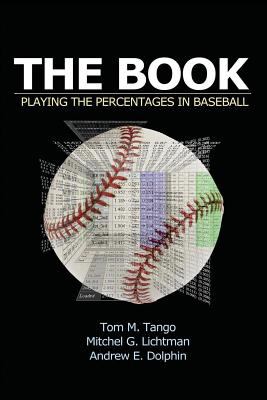
The Book: Playing the Percentages in Baseball (2006)Written by Tom Tango, Mitchel Lichtman and Andy Dolphin, The Book dissects many in-game strategies (bunting, stealing bases, platooning, lineup construction). Much of this had been studied before, but never with decades of play-by-play data to provide valuable insight. |

Diamond Dollars: The Economics of Winning in Baseball (2007)In this book, Vince Gennaro introduces the concept of the “win curve,” the relationship between revenue and team wins. Analysts today frequently write about the dollar value of a win in the free agent market. |

Wins Above Replacement (2008)Although there had been several attempts to measure the totality of a player’s on-field contribution — notably by Pete Palmer (TPR), Baseball Prospectus (WARP), and Bill James (Win Shares) — the one that finally made its way into the general population and remains prevalent today was Wins Above Replacement (WAR). The two most well-known versions of the metric (implemented differently, but using the same scale) are by Sean Smith (who introduced his version at The Hardball Times in 2008), and FanGraphs (2008). Baseball-Reference.com began publishing Sean Smith’s WAR in 2010. |
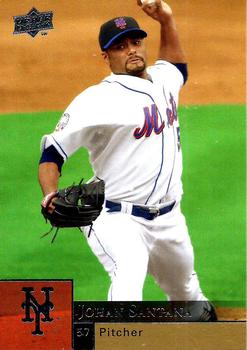
Pitch Values (2008)Utilizing PITCHf/x data, several researchers (Joseph P. Sheehan, John Walsh, etc.) independently began work on measuring the run value of a particular pitch, such as Johan Santana or Pedro Martinez’s changeups. As presented today by FanGraphs, Pitch Value measures the value of a pitcher or batter while throwing or facing a particular pitch. |

Catcher Framing (2011)Mike Fast, writing for Baseball Prospectus, was the first to measure the effect of catcher’s pitch framing, concluding that catchers could gain or cost a team a win or two over the course of a season. |

Increased defensive shifting (2011)One of the more controversial changes to the modern game is the defensive shift, whose prevalence has increased nearly ten-fold since 2011. This shifting has come about because of teams’ desire to play fielders where the batter is likely hit the ball, though its efficacy and aesthetics remain subjects of much analysis and debate. |

Bert Blyleven’s Hall of Fame induction (2011)As more analytical writers were given platforms, many of them took aim at the Hall of Fame selections as evidence that the voting bodies (generally baseball newspaper writers) did not properly value players. Rich Lederer had his own website at BaseballAnalysts.com and he beat the drum for Bert Blyleven for eight years before the Minnesota Twins ace was elected to Cooperstown in 2011. Lederer very likely is the primary reason for Blyleven’s induction. In ensuing years, several other stathead darlings (e.g. Tim Raines, Edgar Martinez) have made the grade, and the voters seemed to have turned this corner. |

SABR Analytics Conference (2012)Held annually in March in Phoenix, the SABR Analytics Conference includes research presentations, guest speakers from throughout the baseball industry, career development networking, and a student case competition. For gathering the best young minds in the field, it is the first and best of its kind. |

SABR Defensive Index added to Gold Glove Awards (2013)Beginning in 2013, the SABR Defensive Index was added to help select the winners of the Rawlings Gold Glove Award and Platinum Glove Awards — as both a “voter” and by having the numbers shared with all managers and coaches who make up the rest of the voters. SDI is an aggregation of the most prominent existing defensive metrics: Baseball Info Solutions’ DRS, Mitchel Lichtman’s UZR, Chris Dial’s RED, Michael Humphrey’s Defensive Regression Analysis, and Sean Smith’s Total Zone Rating. |

Parks and Recreation “Easter Egg” (2013)In the season finale of this beloved NBC television show, statistically minded baseball fans were presented with an inside joke: a sign at a Pawnee, Indiana law firm reading “Law Offices of Babip, Pecota, Vorp, and Eckstein, Attorneys at Law.” Show-runner and executive producer Michael Schur and writer Alan Yang had both written for FireJoeMorgan.com. |
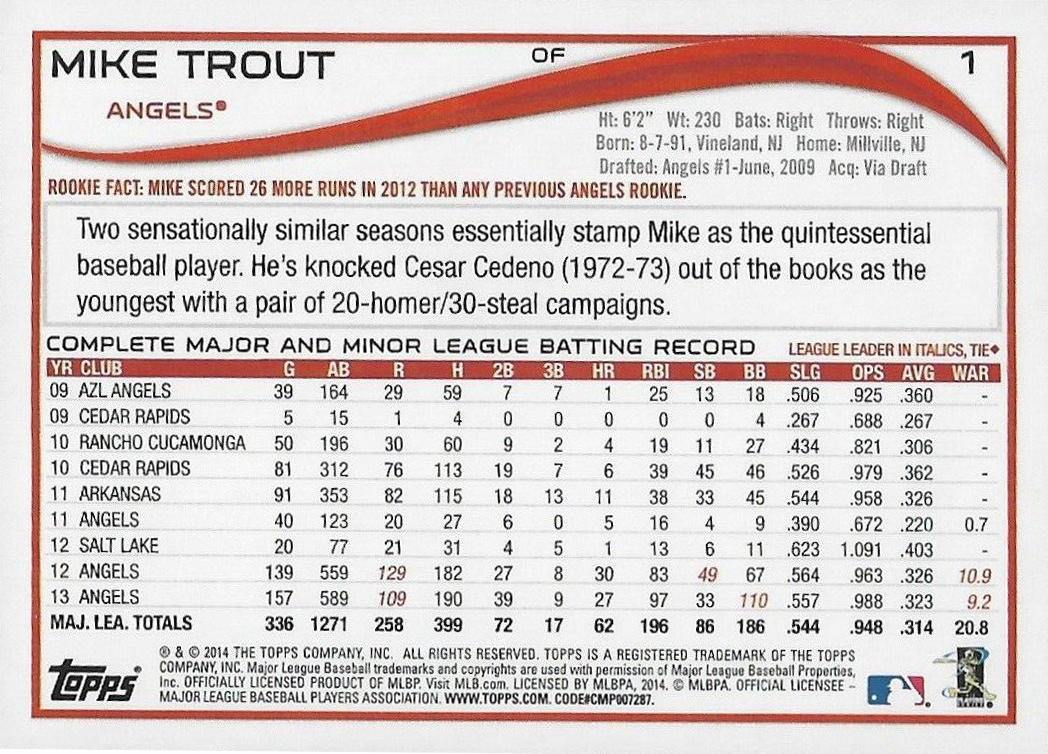
Topps baseball cards include WAR (2014)After a few decades using traditional baseball stats (H, R, HR, RBI, BA) on its card backs, Topps slowly started to sprinkle in slugging percentage, on-base-percentage, and OPS (2004). In 2014, Topps started using Baseball-Reference’s version of Wins Above Replacement for the first time. |
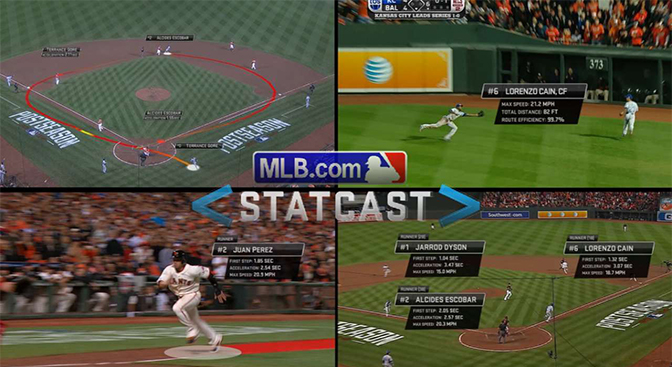
MLB Statcast makes its debut (2014)Major League Baseball’s high-speed video system was deployed in three venues in 2014 and all 30 ballparks the next year. Statcast measures the physical movement and performance for pitchers, batters, defenders and base runners, and every team employs analysts to work with their own data. Outs Above Average, MLBAM’s defensive statistic that measures the outs a player records compared with an average player, was launched for outfielders in 2017 and infielders in 2020. |

FOX’s sabermetric telecast of NLCS (2014)During Game One of the NLCS, television viewers were given a choice between the traditional announcing crew on FOX and a more stat-focused conversation on Fox Sports 1 with Kevin Burkhardt, Bud Black, Gabe Kapler, C.J. Nitkowski, and Rob Neyer. ESPN launched a similar analytically focused telecast for the 2018 NL Wild Card Game with Jason Benetti, Mike Petriello, and Eduardo Perez, and has repeated this model several times since. |
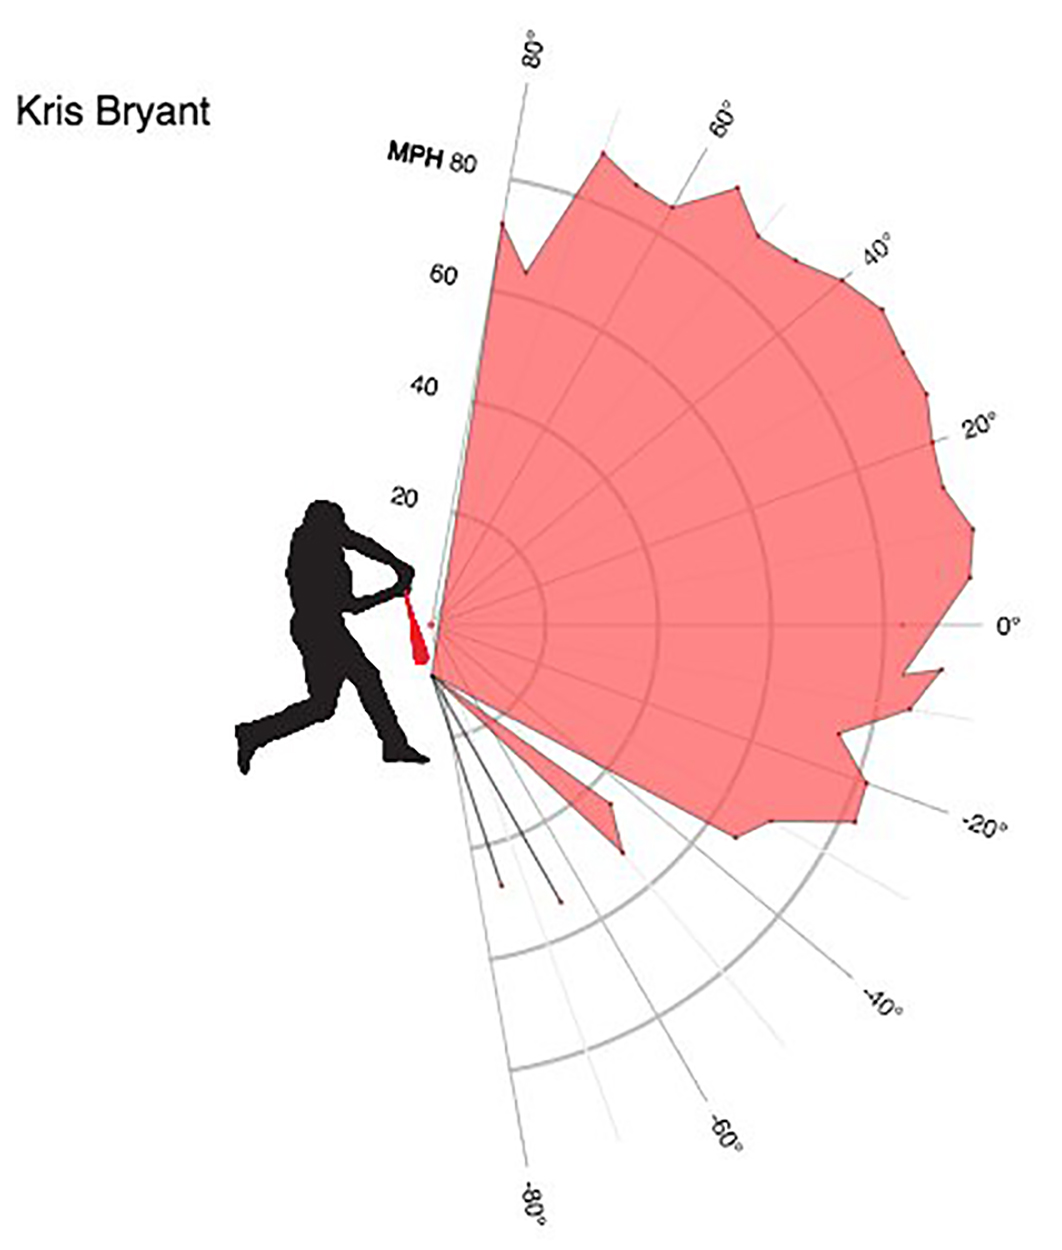
Baseball Savant launches (2016)Created by Daren Willman in 2013 and then brought to MLB in 2016, Baseball Savant hosts statistical leaderboards and blog posts devoted to analysis of MLB’s Statcast data. If you want to know who hits the ball the hardest or who had the most barrels in the latest MLB season, this is the place to go. |
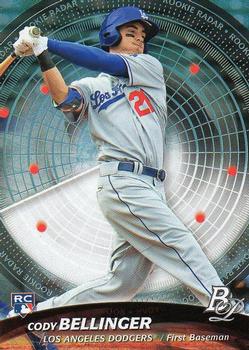
Launch Angle revolution (2017)Long ago, Ted Williams preached that the best way to hit a baseball was with a slight uppercut and a great deal of speed. Statcast precisely measures these two factors for every batted ball, proving Williams’s theory to be correct. Soon nearly every team and player came on board, learning to optimize their swing planes to achieve the best results. |
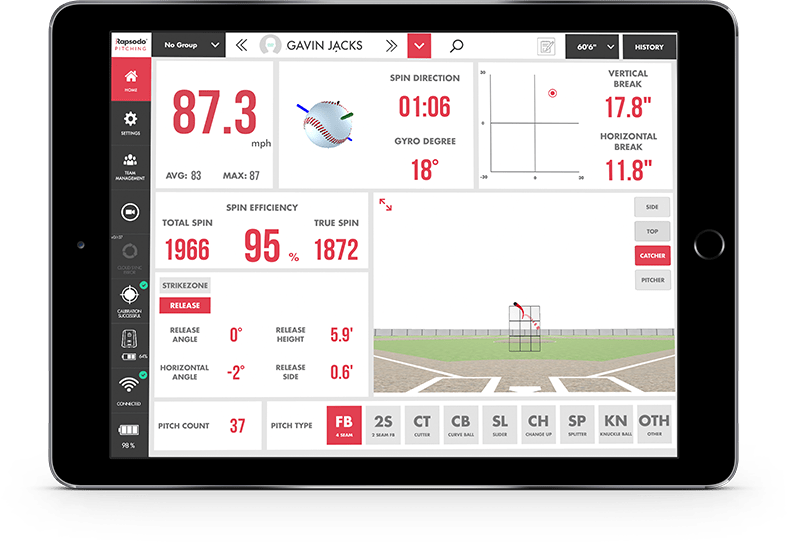
Performance Tech (2020)Although the rollout did not all come at once, by the end of the 2010s, baseball teams were spending a lot of money on tech equipment to analyze player or equipment mechanics and produce data to be analyzed. This explosion has included Rapsodo (which measures the pitched baseball), Blast Motion (bat mechanics), KinaTrax (pitching mechanics), Edgertronic (pitching mechanics), TrackMan (ball tracking) and Hawk-Eye (informed decisions on whether to challenge umpire calls). |
Photo credits: Baseball Digest, Baseball Prospectus, Baseball-Reference.com, Baseball Think Factory, Don Zminda, FanGraphs, Fox Sports, MLB.com, National Baseball Hall of Fame Library, NBCUniversal Media, Rawlings Sports, Retrosheet, Sports Illustrated, Trading Card Database, Voros McCracken. Used by permission.


